How To Read A Crypto Chart
Last updated November 4, 2024
Learn How To Read A Crypto Chart
The main goal of trading is to buy low and sell high. To be successful, any trading strategy needs to assess where the price currently stands and where it may head at. The ability to read a crypto chart makes the difference in the ultimate result of the strategy.
Charts inform the trader about the previous and current prices. This data can help to take more appropriate actions to take advantage of future price movements.
The main benefit of being able to read a crypto chart are:
- Improved planning of strategy
- A better understanding of how the strategy will work
- The possibility of adjusting more efficiently the parameters of the system according to market conditions.
Timeframes of Crypto Charts
As a first step, you need to select the right time frame according to your strategy. Tradingview is a great (and free!) charting tool where you can keep track of all the coins traded across many crypto exchanges.
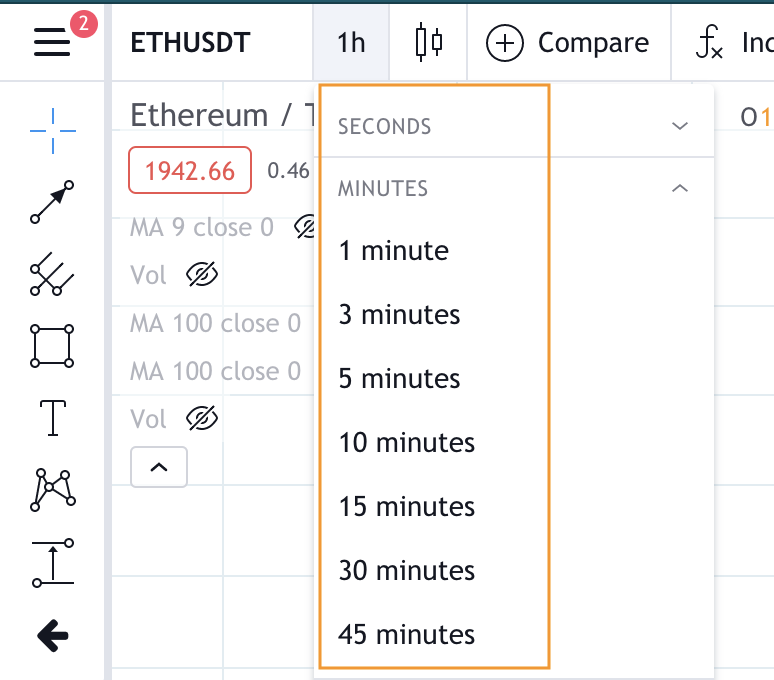
If you are looking for quick trades, catching short-term opportunities, you should select a lower time frame, such as the 5-minutes or the 15-minutes.
On the other hand, if you are building a long-term strategy chasing less frequent and more significant price swings, you may opt for the 1-hour or 4-hour time frames.
The daily (1-day) time frame fits the strategies you will expect to run for months or years.
Coinrule also enables the possibility of adding multiple time frames within the same rule. Just like advanced traders look at the price of the same coin from different time frames to have a more extensive idea of the trend, you can incorporate this approach into your rules.
This is an example of a strategy that works on different time frames.
The Japanese Candlestick Chart
Hands down, the Japanese candlesticks are the best way to read a crypto chart. They provide all relevant information about how the price moved in a specific time frame with a straightforward and direct visual representation.
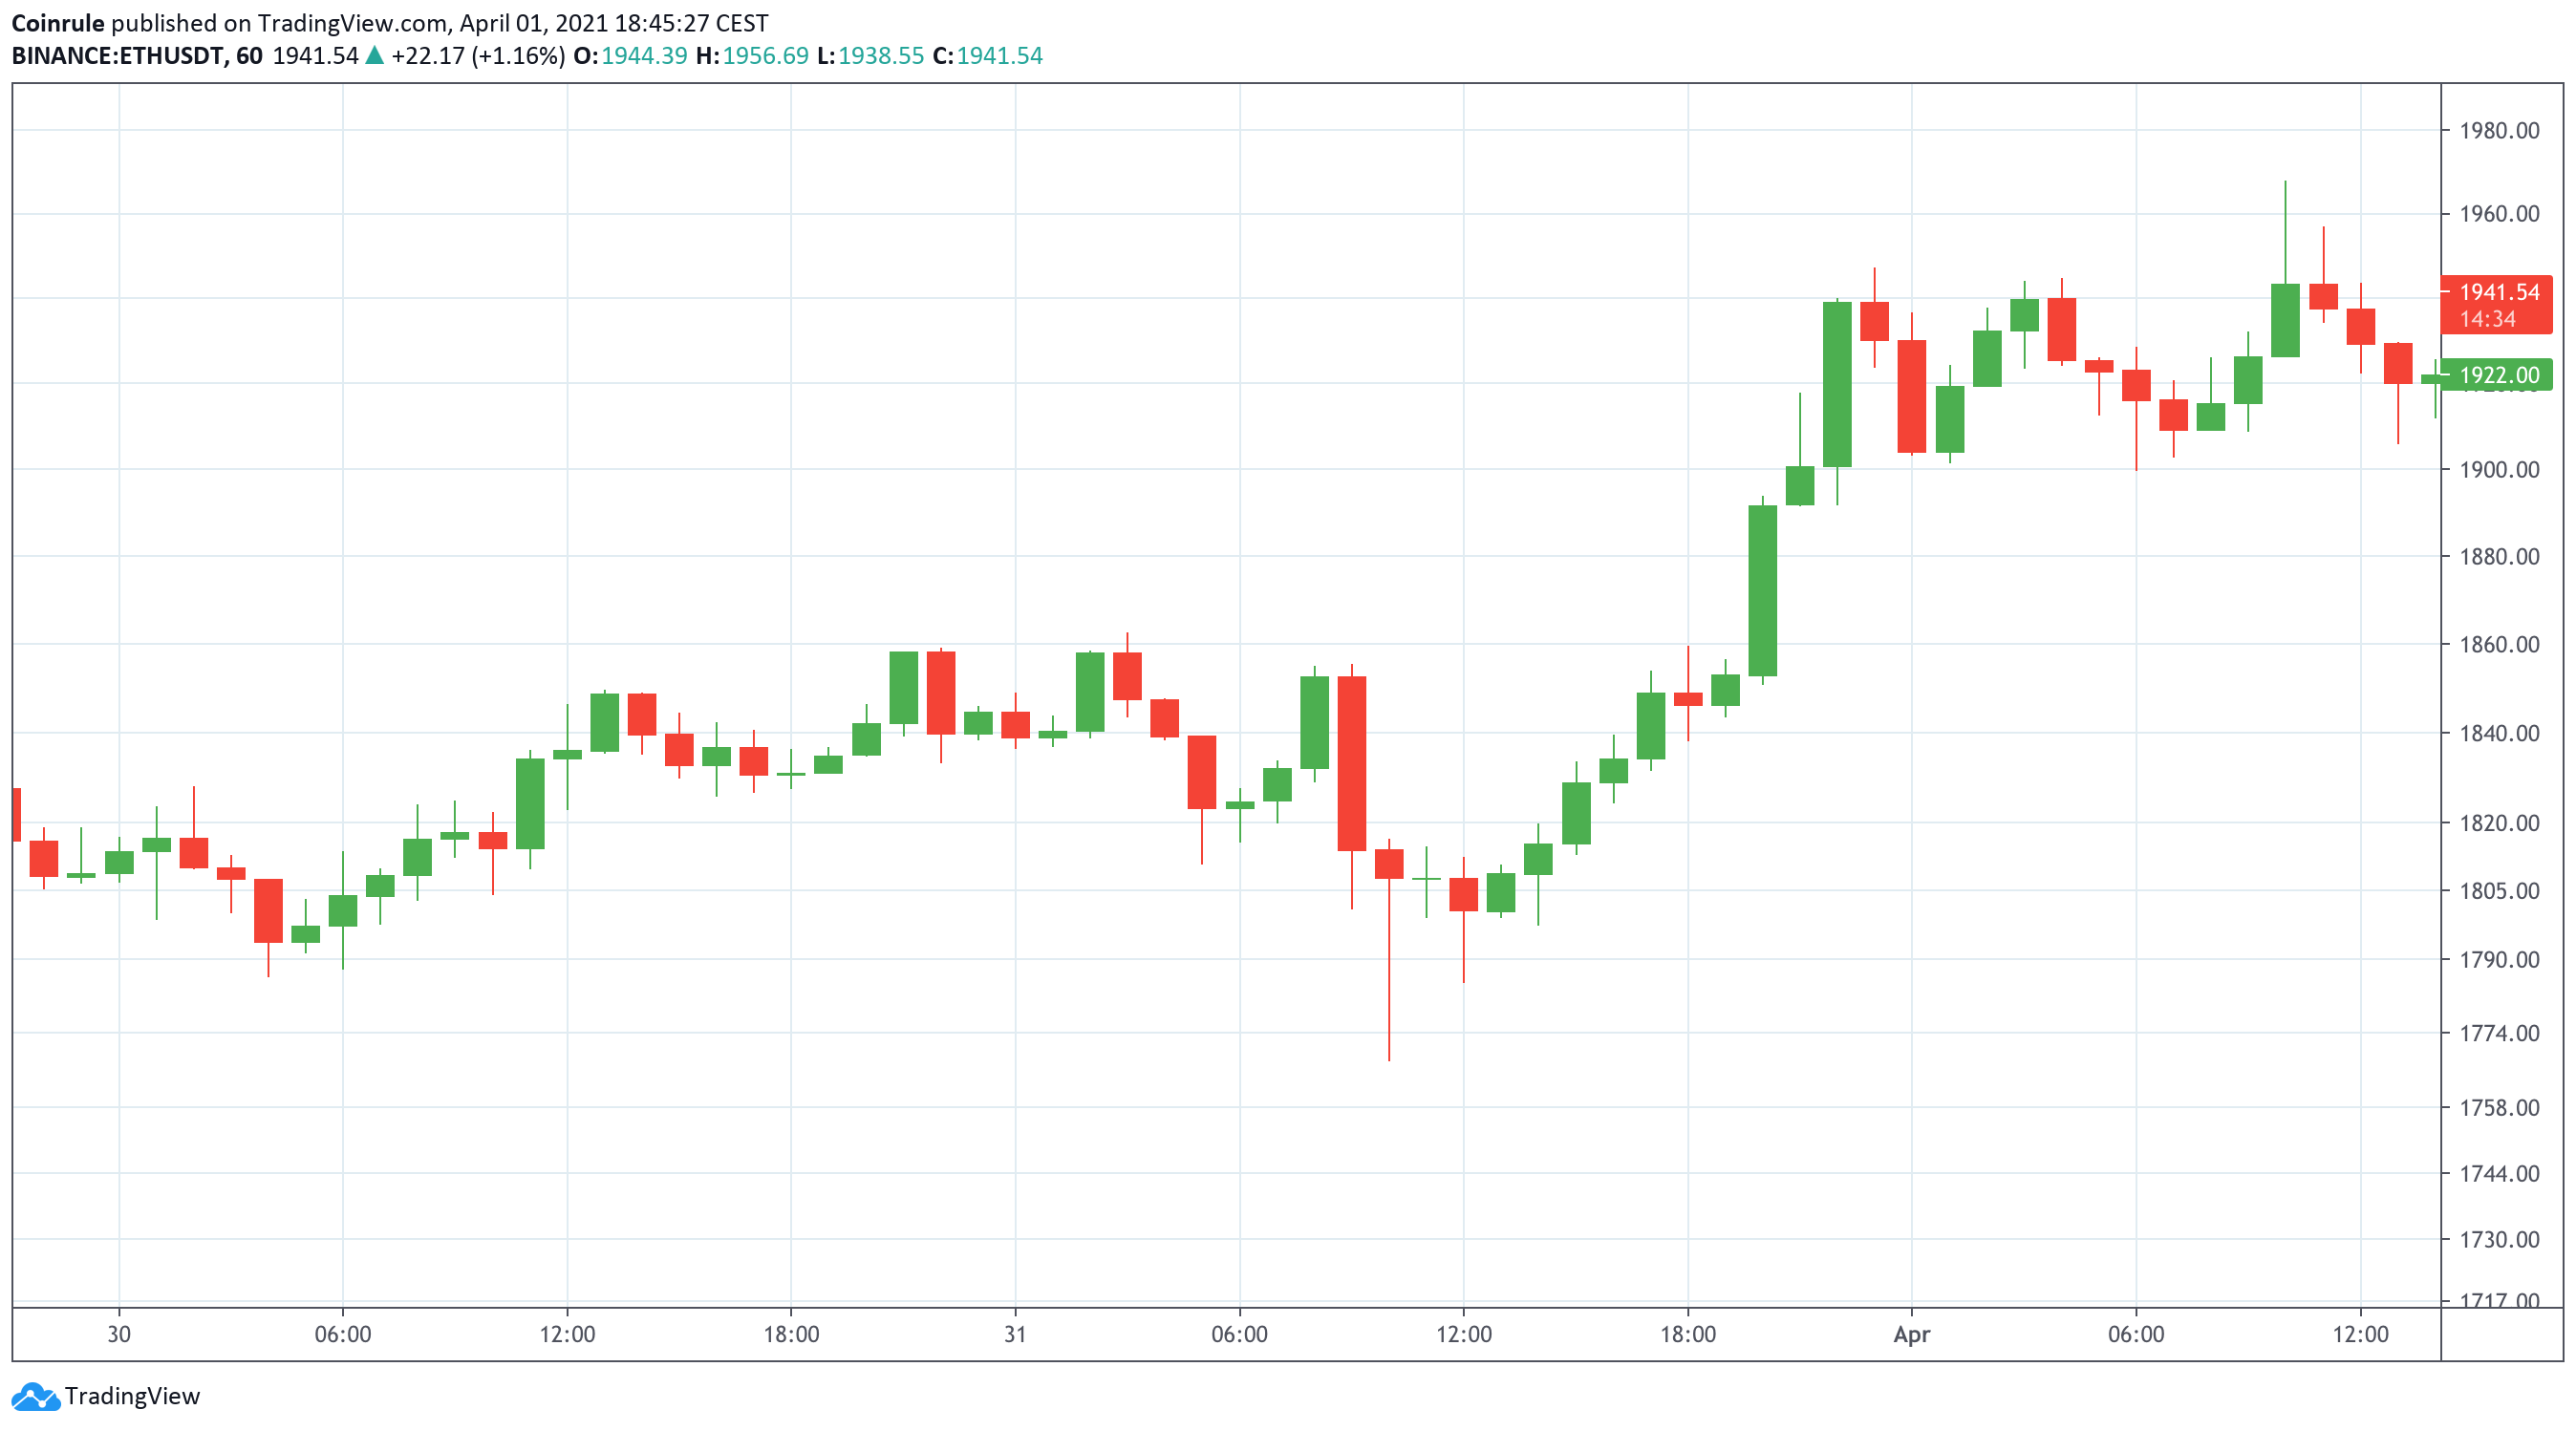
The graph above is an hourly candlestick chart for the pair ETH/USDT on Binance Exchange. The first thing you will notice is the red and green candlesticks printing one after another. Each candle portrays the main direction of the price movement of the currency during that specific time interval.
What does a candlestick represent?
Including the closing price, each candle shows the opening price, the lowest and highest price of the given period. As depicted in the image below.
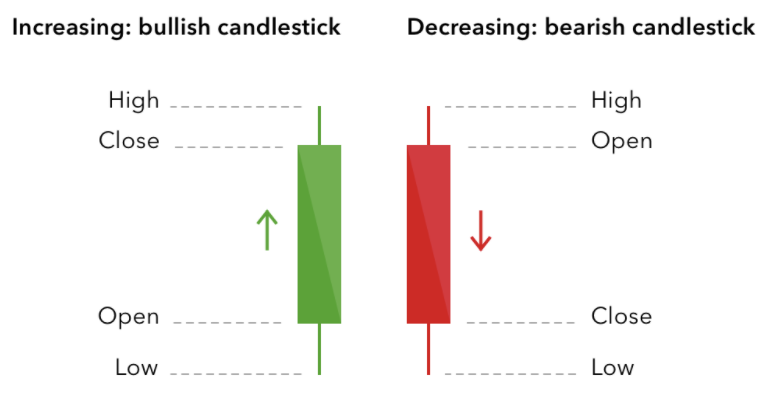
The benefit of candlesticks is that they clearly show what happened in this exact timeframe, which can help traders identify patterns.
Understanding Coinrule executions when reading charts
Coinrule uses candlesticks as references when calculating price moves. Thus on the candlestick, you would be looking at the closed price and measuring the change from there.
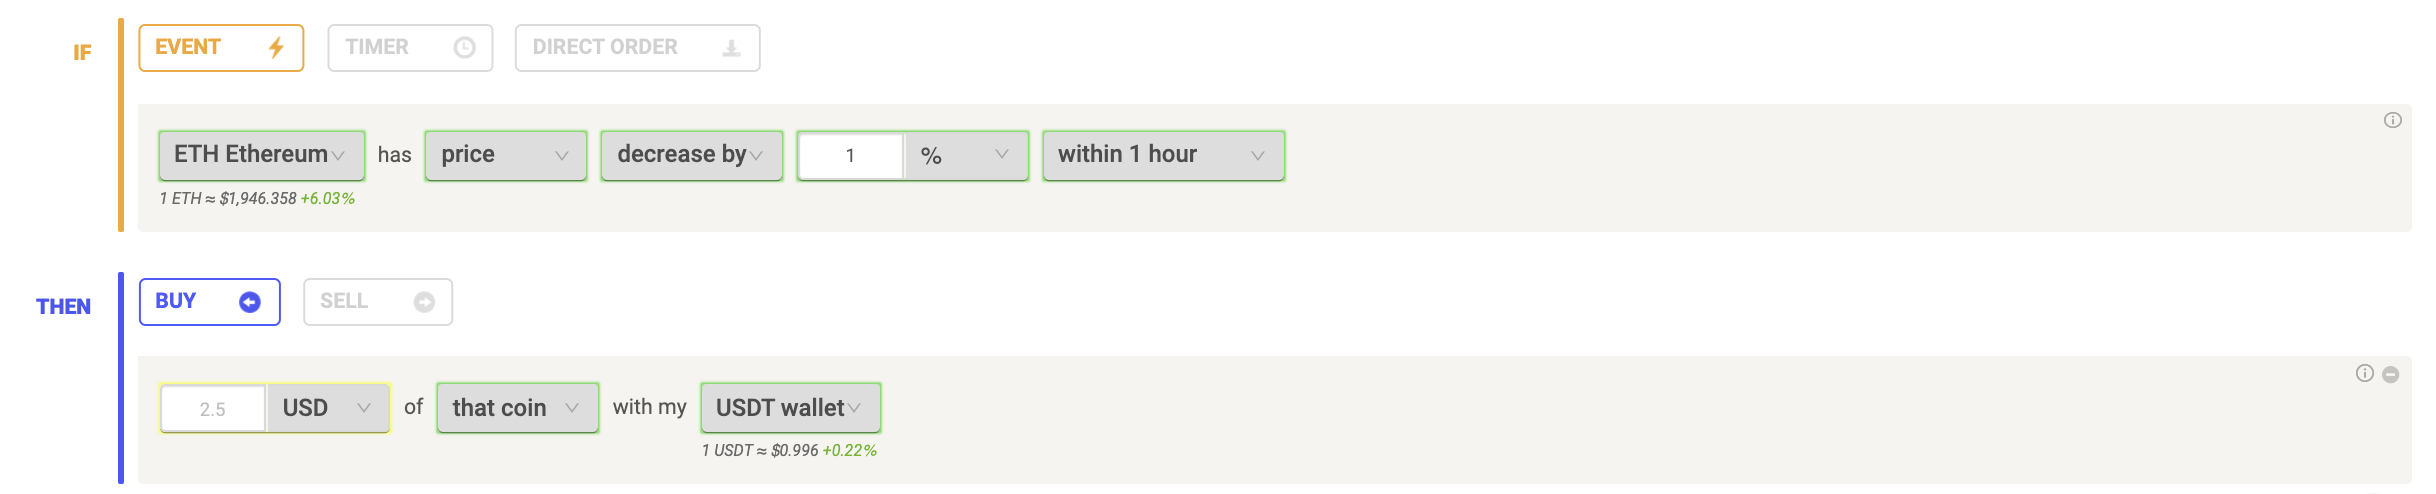
To check when a rule such as the one above should execute, first load the 1-hour chart of the trading pair you want to study. Trading Ethereum and selecting the USDT wallet results in the bot checking the ETHUSDT trading pair.
Then check to see if there are any significant decreases. This is typically signified with a large red candle, as shown below.
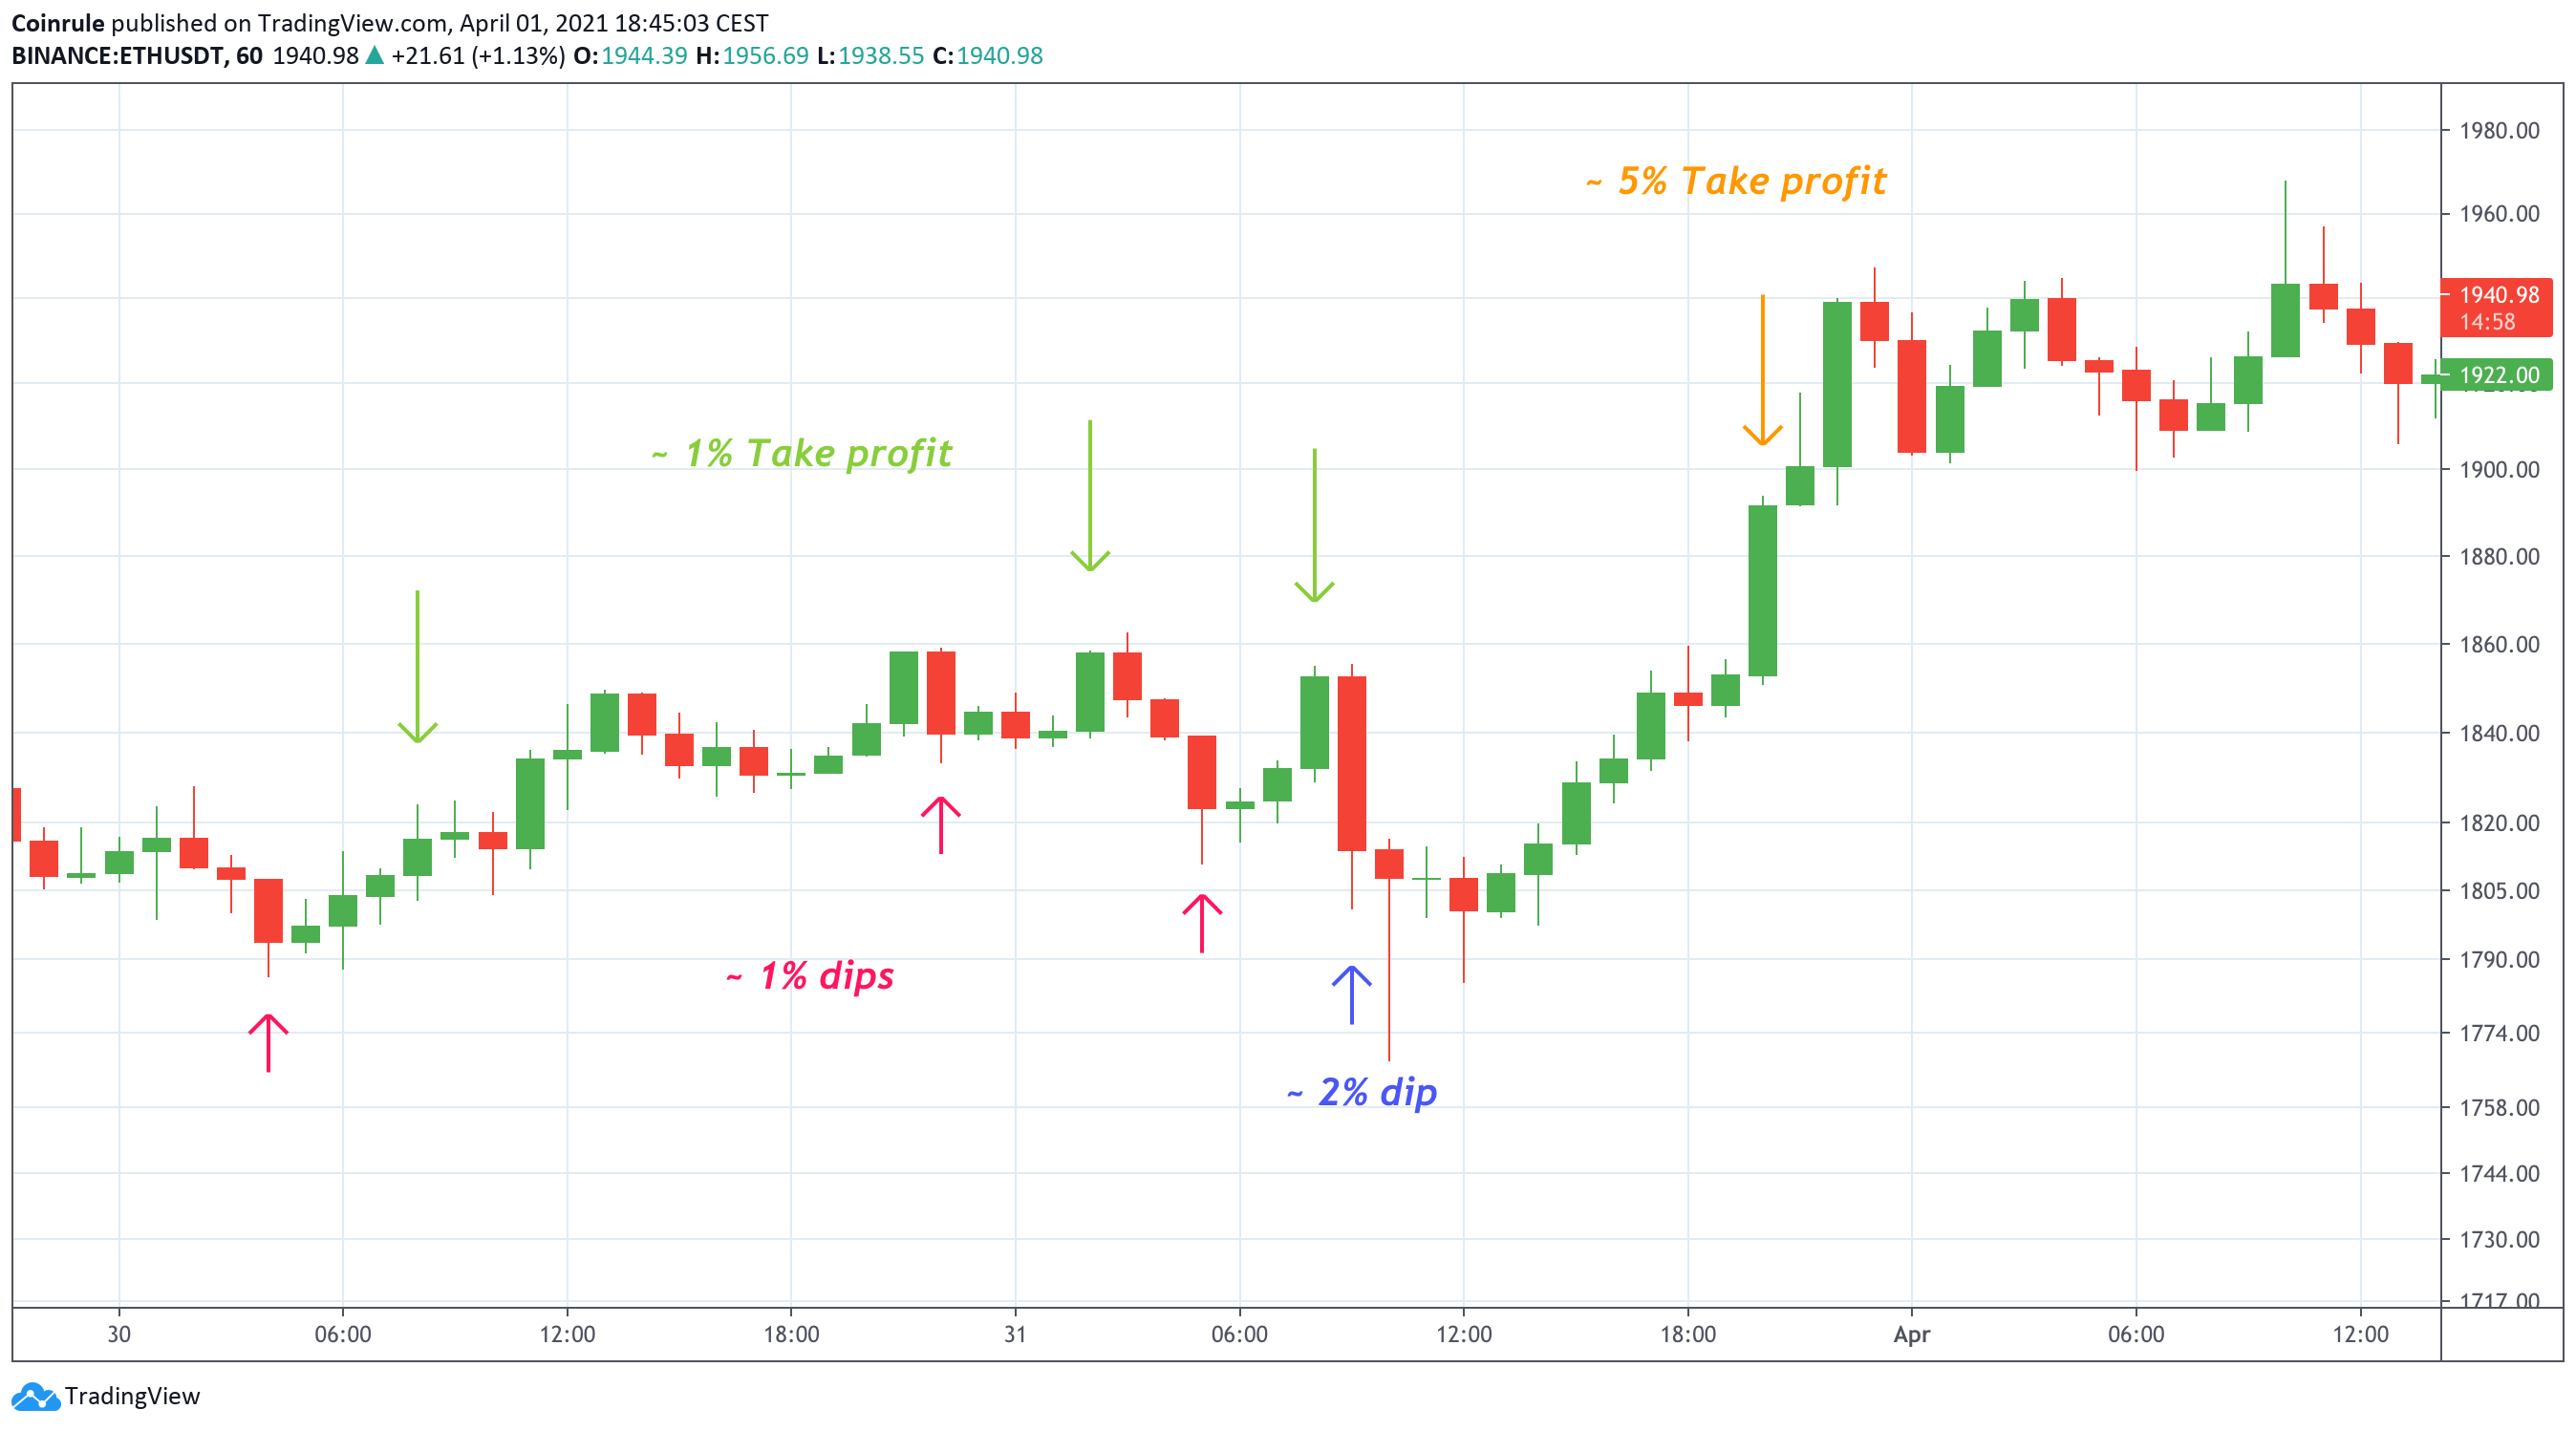
As you can see reading the crypto chart of ETHUSDT, small dips result usually in small swings, larger ones indicate larger volatility so you can set a larger take profit.
You can either try catching more frequent small profits, or you can trade less often but chasing larger profits. That ultimately depends on your trading style and preferences.
The previous candle’s close price is used to measure the price decrease. For a rule to execute, the price decrease has to occur within one candle. If the price falls more than the specified value, the rule would have executed once the price difference equals the set target.
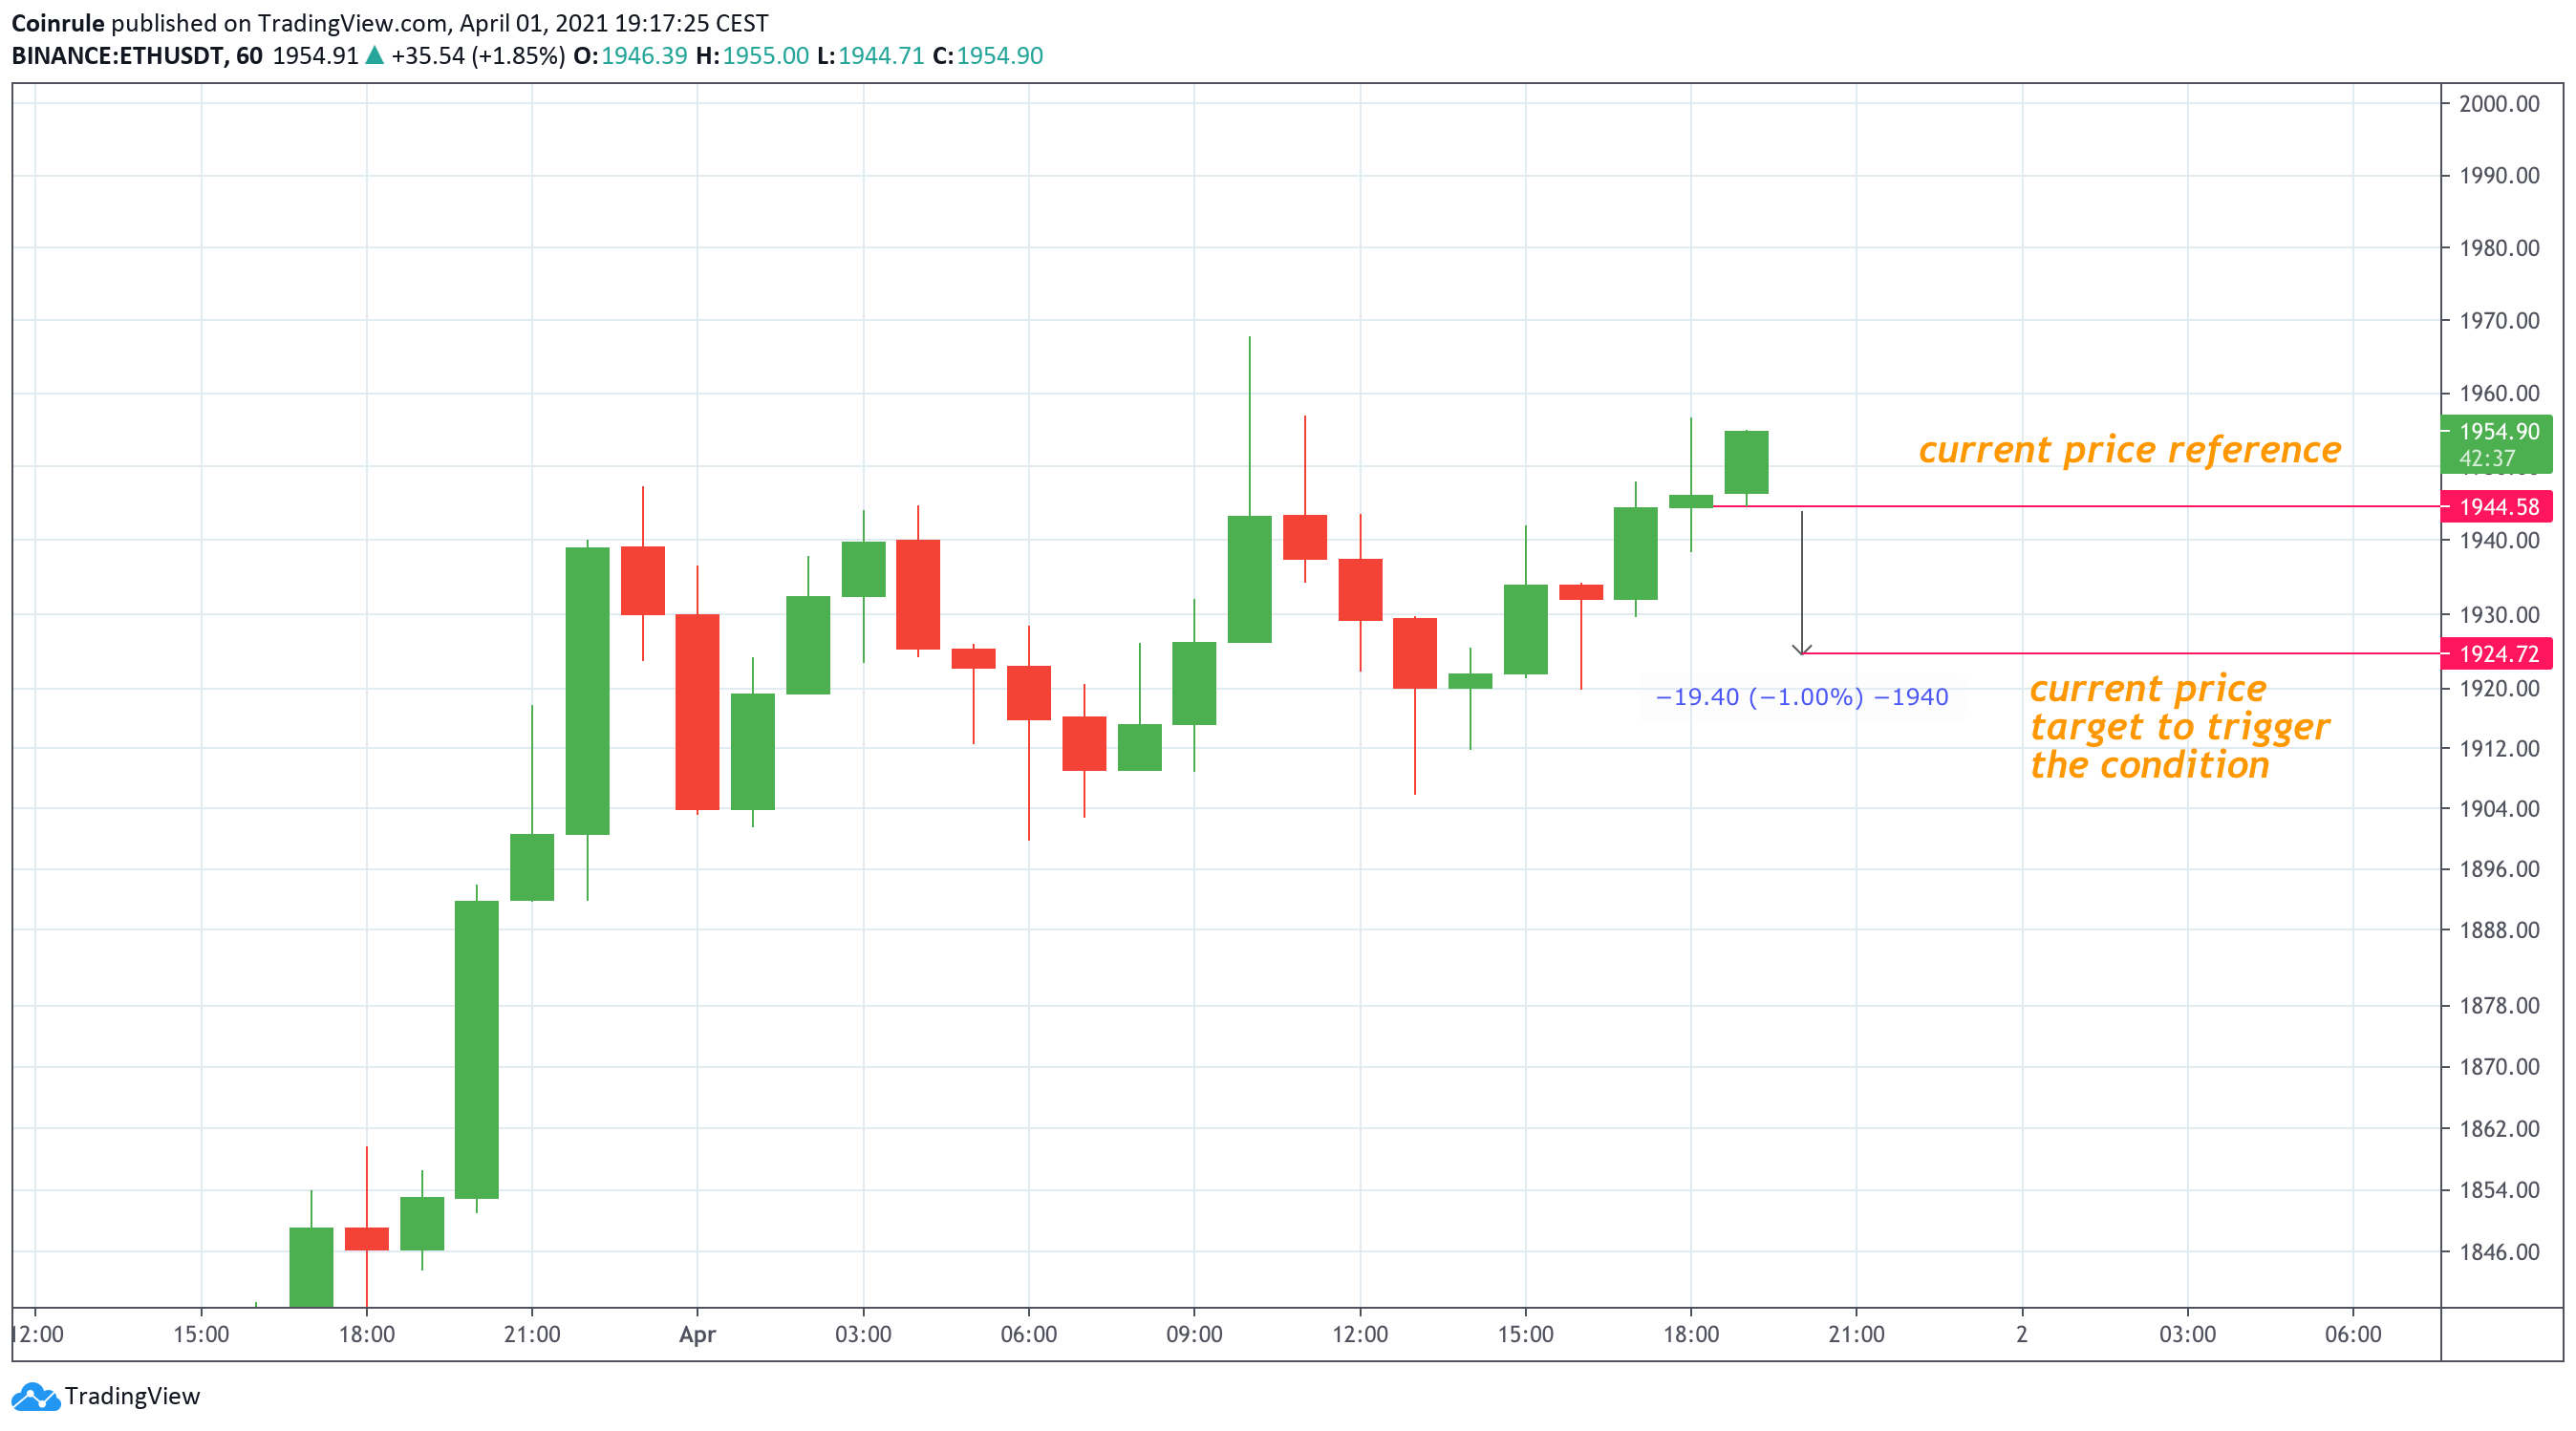
If the price decrease does not happen in the current candle, the price reference is updated with a new reference. You can read more in this article .