Time Frames For Price Changes
Last updated November 4, 2024
Understanding Time Frames For Price Changes
There are endless trading strategies that traders can build. The style and the approach of each system depend mostly on
- the indicator selected
- the time frame of the indicator.
The time frame determines the calculation of the indicator, and thus, has a key role in shaping the trading strategy.
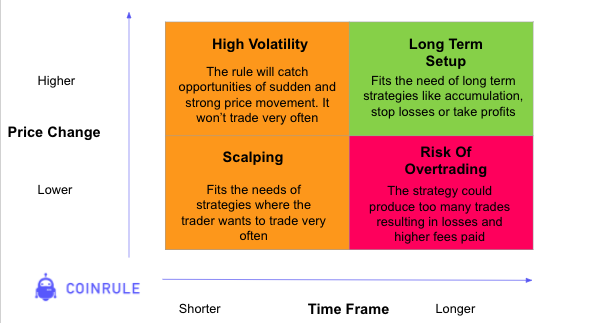
For example, regarding the choice of a price change in a condition, you can set a higher or lower price change, and you can calculate it on a longer or shorter time frame.
This matrix summarizes how these elements influence the style of the strategy.
How we calculate the time frames for price
After selecting an indicator to add to your condition block, you need to choose the time frame in which to calculate it.
Let's take as an example a "price increase within 15 minutes".
That means that the price reference to calculate the price increase is updated every 15 minutes. The bot uses candlestick data so that at any time, it compares the market price to the closing price of the first previous 15-minutes candle.
You can check the time frame on a chart to see how it works. The example below shows how it would work.
The current price increase of BTCUSDT within 15 minutes is around +0.40%
When you select a time frame, the bot dynamically follows the market trend. If you prefer to use a fixed price reference, you can use "from current market price" instead.
In the realm of cryptocurrency trading, the use of 'closed candles' is pivotal for accurate analysis and decision-making. Trades are executed on Coinrule based on closed candles. Read more here
What Are Closed Candles?
Closed candles are candles that have completed their time period and have a finalized set of data. This is in contrast to an 'open candle' which is still forming and whose final values can change until the time period closes. Using closed candles for technical analysis provides a more stable and reliable foundation for evaluating market trends and making trading decisions. It ensures that all the information used has been settled, reflecting a full cycle of trading dynamics within the time frame selected.
Example from a Chart
For instance, in a 1-hour candlestick chart, each candle represents price movement over one hour. A closed candle on this chart means that the hour has ended and the next candle begins. If a trader is looking at a candle from 2 PM to 3 PM, once the clock strikes 3 PM, that candle is considered closed, and the analysis will only consider the data between 2 PM and 3 PM. Below is an example of how closed candles might appear on a chart:
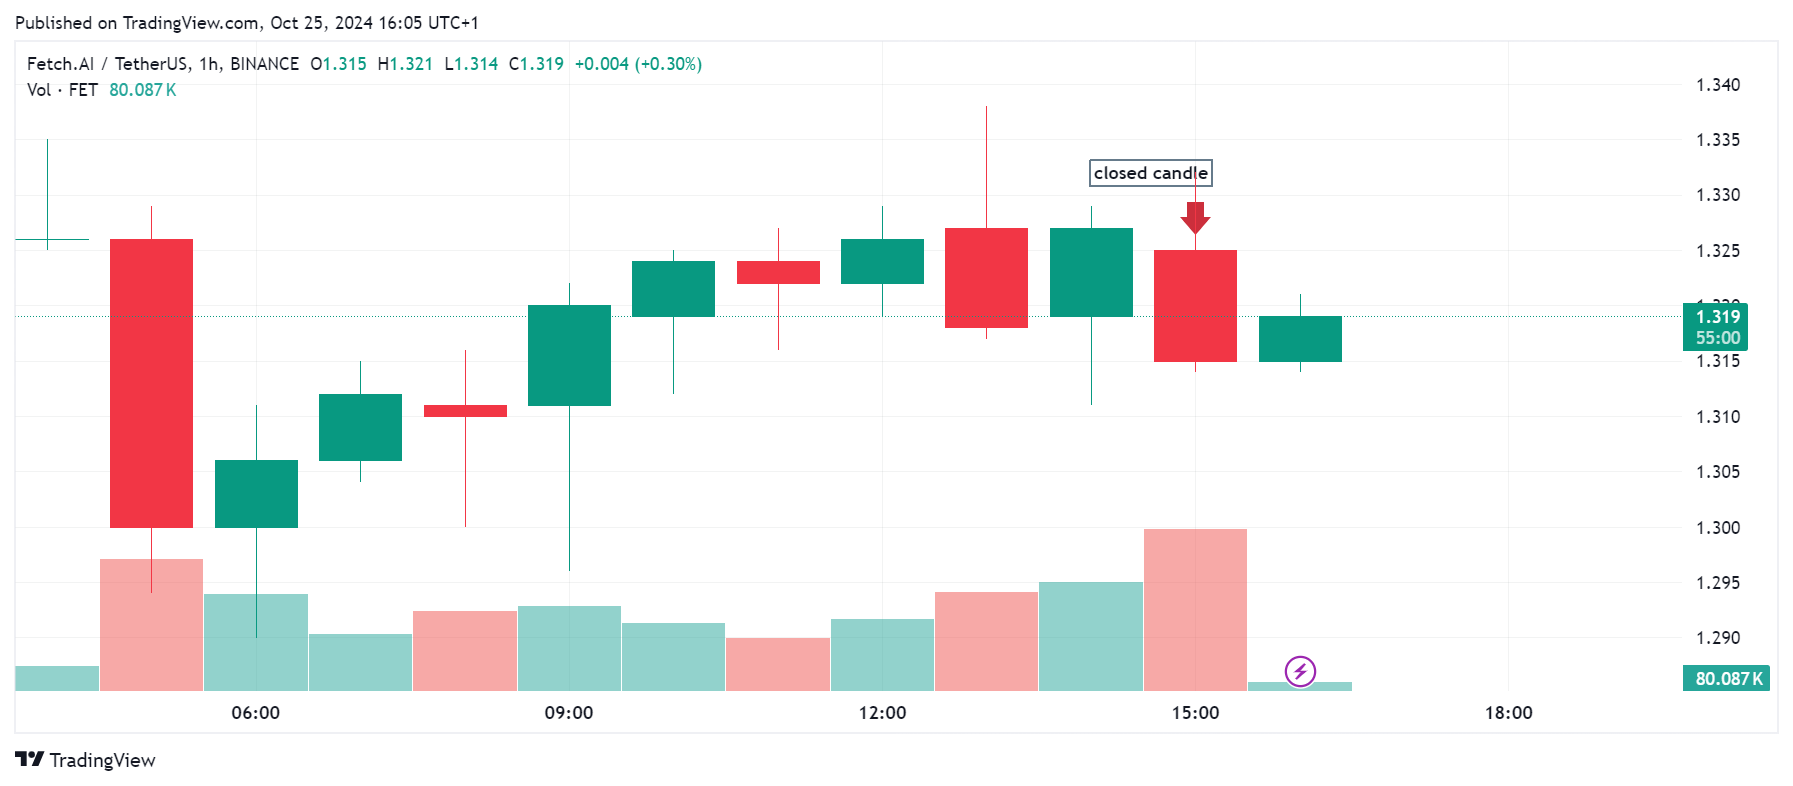
Here, you can see several closed candles, each indicating the finalized state of market conditions over successive time frames. Traders would use this finalized information to predict future movements or confirm past trends.