How To Use Relative Strength Index (RSI)
Last updated November 3, 2024
How To Use Relative Strength Index (RSI)
What is the Relative Strength Index (RSI)?
The relative strength index (RSI) is a momentum indicator used in technical analysis. RSI measures the speed and magnitude of a security's recent price changes to evaluate overvalued or undervalued conditions in the price of that security.
The RSI is displayed as an oscillator (a line graph) on a scale of zero to 100. The RSI can do more than point to overbought and oversold securities . It can also indicate securities that may be primed for a trend reversal or corrective pullback in price. It can signal when to buy and sell. Traditionally, an RSI reading of 70 or above indicates an overbought situation. A reading of 30 or below indicates an oversold condition.
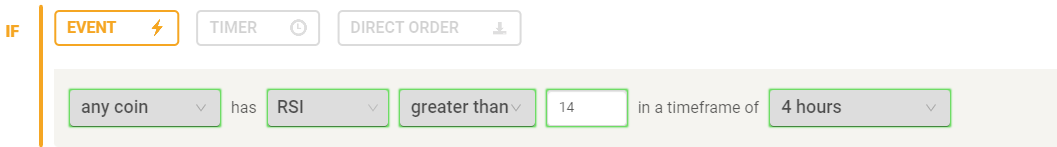
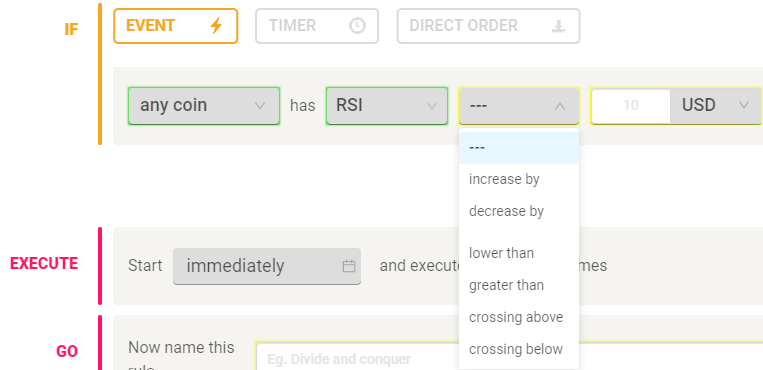
RSI Offerings on Coinrule
How the Relative Strength Index (RSI) Works
As a momentum indicator, the RSI compares a security's strength on days when prices go up to its strength on days when prices go down. Relating the result of this comparison to price action can give traders an idea of how a security may perform. The RSI, used in conjunction with other technical indicators, can help traders make better-informed trading decisions.
Overbought or Oversold
Generally, when the RSI indicator crosses 30 on the RSI chart, it is a bullish sign and when it crosses 70, it is a bearish sign. Put another way, one can interpret that RSI values of 70 or above indicate that a security is becoming overbought or overvalued. It may be primed for a trend reversal or corrective price pullback . An RSI reading of 30 or below indicates an oversold or undervalued condition.
KEY TAKEAWAYS
- The standard number of periods used to calculate the initial RSI value is 14.
- The RSI provides technical traders with signals about bullish and bearish price momentum, and it is often plotted beneath the graph of an asset’s price.
- An asset is usually considered overbought when the RSI is above 70 and oversold when it is below 30.
- The RSI line crossing below the overbought line or above oversold line is often seen by traders as a signal to buy or sell.
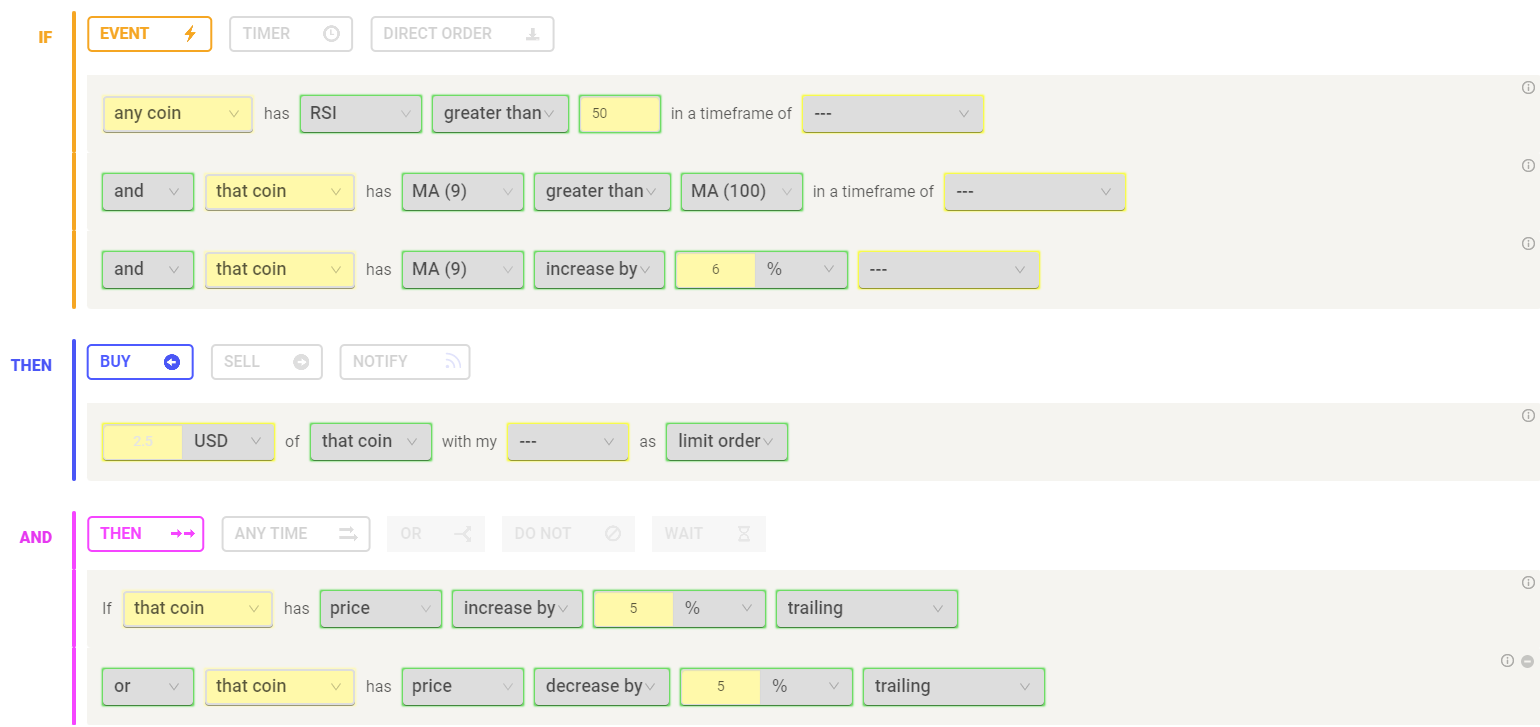
Below is an example strategy using RSI while trading on Coinrule:
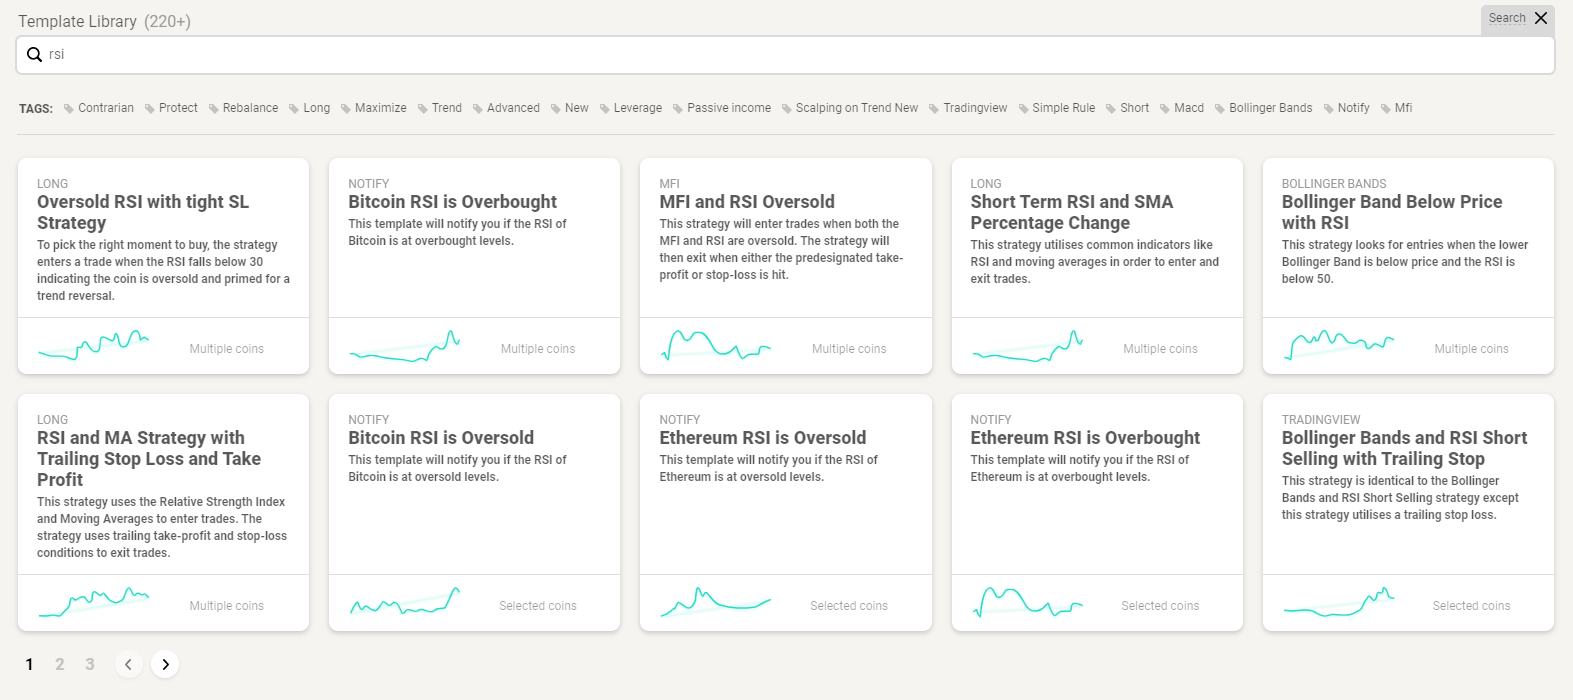
Check out some of our RSI templates to get started with building this indicator into your strategies:
Happy Trading!