How To Use Bollinger Bands (BB)
Last updated November 3, 2024
Learn How To Use Bollinger Bands (BB)
Bollinger Bands are now live on Coinrule !
What are Bollinger Bands?
Bollinger Bands are among the most famous and widely used technical analysis indicators. They were created by John Bollinger in the early 1980’s. A Bollinger Band is a technical analysis tool defined by a set of trendlines traditionally plotted two standard deviations (positively and negatively) away from a simple moving average (SMA) of an asset’s price. The SMA (the middle line) then serves as a base for the Upper and Lower Bands which are used as a way to measure volatility by observing the relationship between the Bands and price. When the Bands are converging and the gap between them is small, it indicates that volatility is low and that a breakout could be imminent.
Determining breakout direction
Determining the breakout direction is somewhat more challenging. John Bollinger suggests using a combination of other indicators, such as the RSI, in conjunction with his Bands to try and identify the breakout direction.
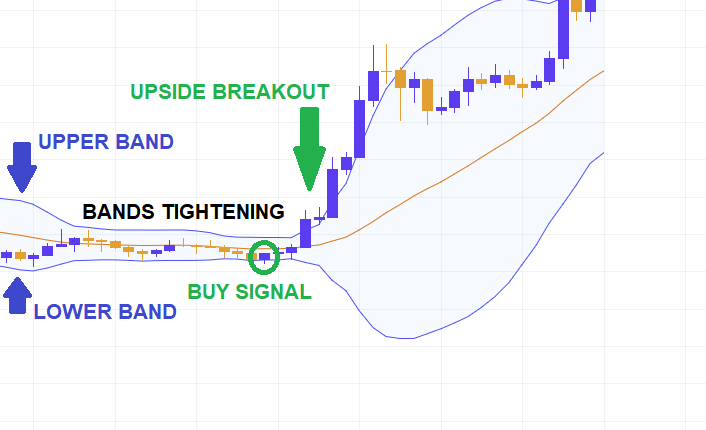
Additionally, if there is a positive divergence, that is if the indicators are heading upwards while the price is heading down (or staying relatively stable), it is a bullish signal and hence an upwards breakout is more likely. Conversely, if the price is moving higher but the two bands are displaying negative divergence, a downside breakout is the more likely scenario. Other important signals can come when the price breaks the Upper and Lower Bands. When the price breaks the Lower Band, it can act as a buy signal and the opposite is true when the price breaks the upper band. Let’s take a look at an example:
In the above example, the tightening of the Bands provided an indication that a breakout could be imminent. When the price broke the lower band, it would have been a great buying opportunity as there was a massive upwards breakout following this signal.
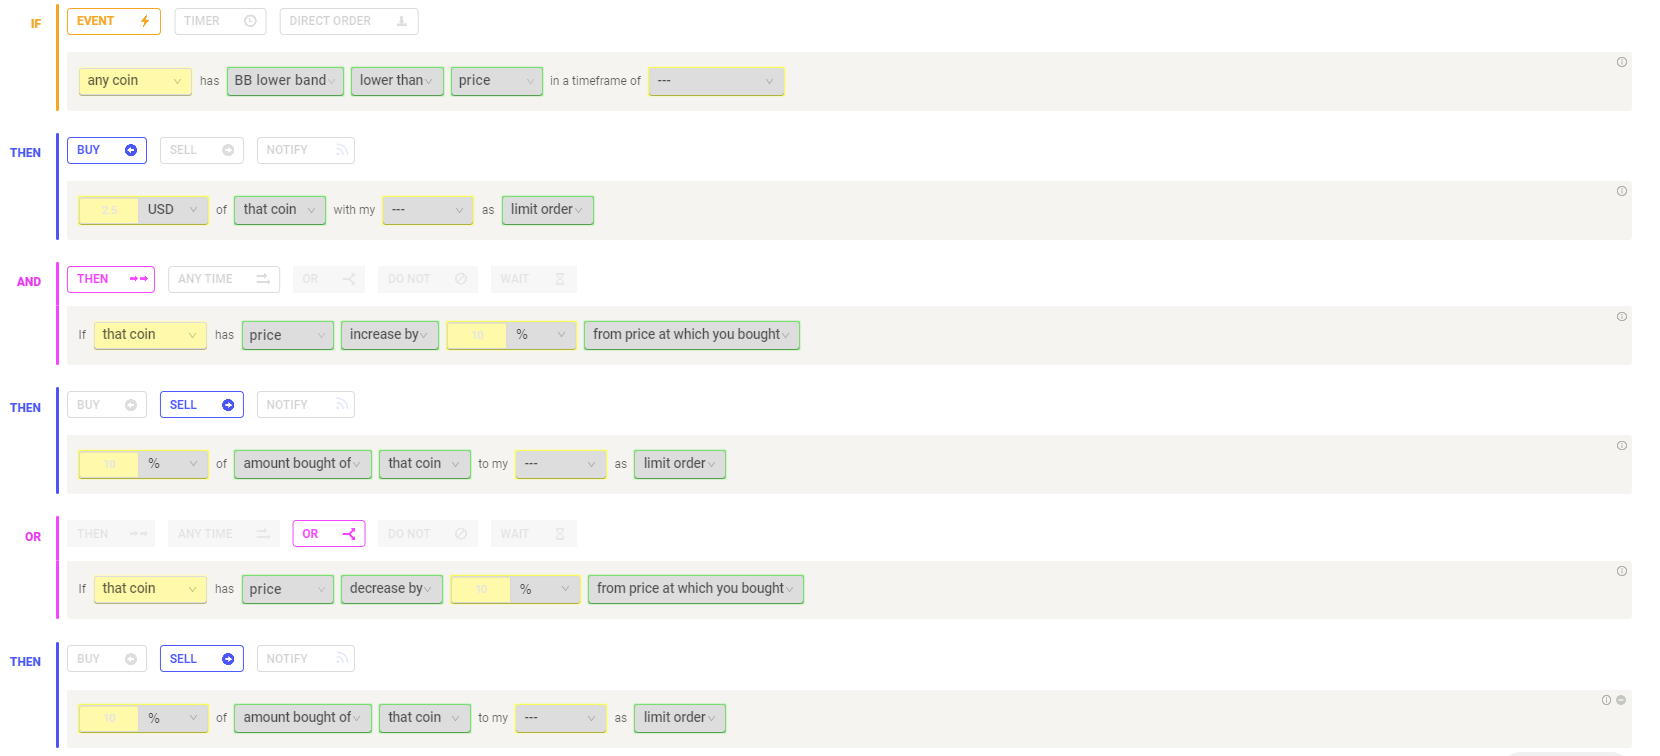
Another example is the Bollinger Band Below Price strategy which can be found in our Template Library:
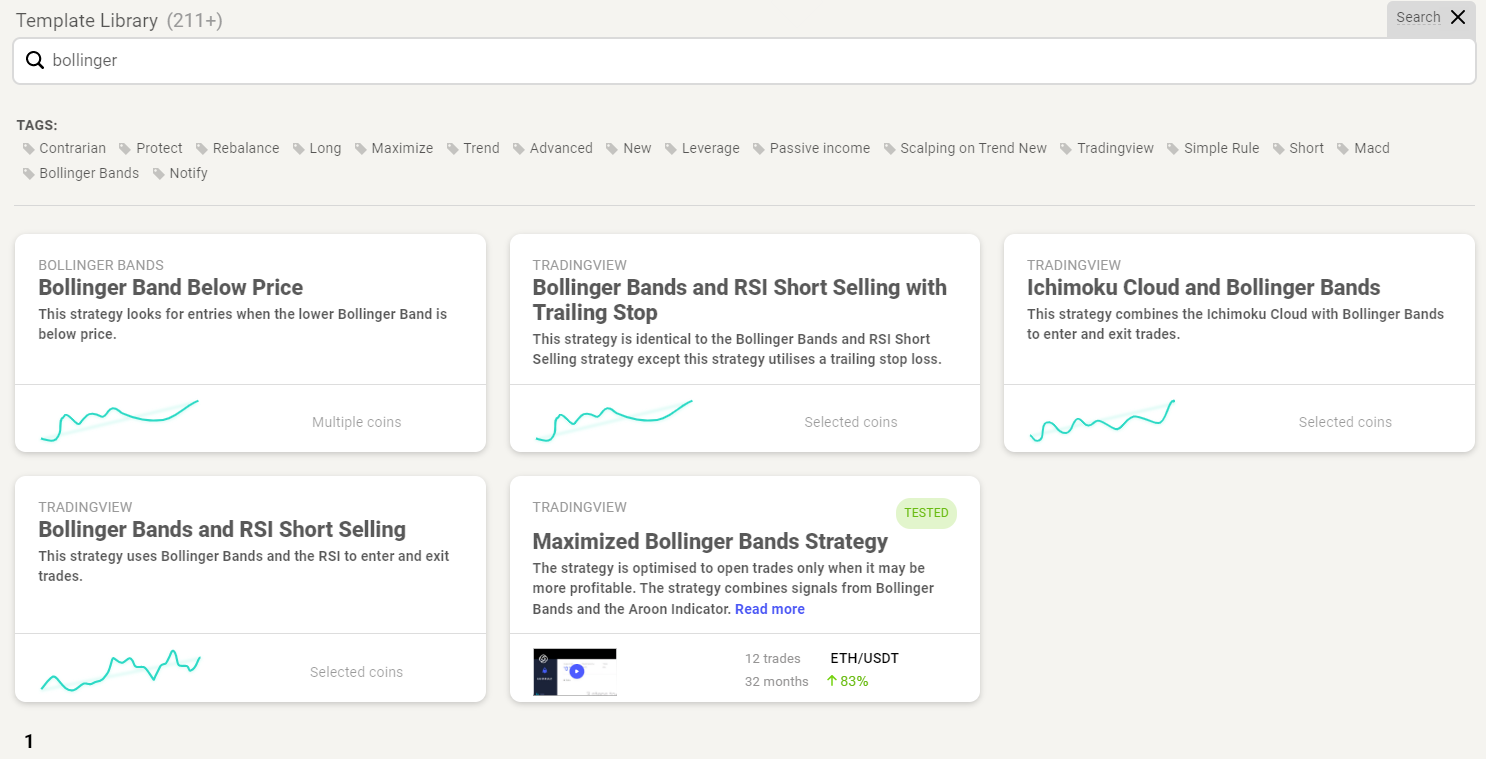
Check out some of our Bollinger Bands templates to get started with building this indicator into your strategies.
Happy Trading!


