How To Use Moving Average Convergence Divergence (MACD)
Last updated November 3, 2024
Learn How To Use Moving Average Convergence Divergence (MACD)
We have have now integrated support for the MACD (Moving Average Convergence Divergence) indicator, giving you even more customizability for your strategies!

The MACD is a trend-following momentum indicator that shows the relationship between two moving averages of an assets price. The MACD is calculated by subtracting the 26-period exponential moving average (EMA) from the 12-period EMA.
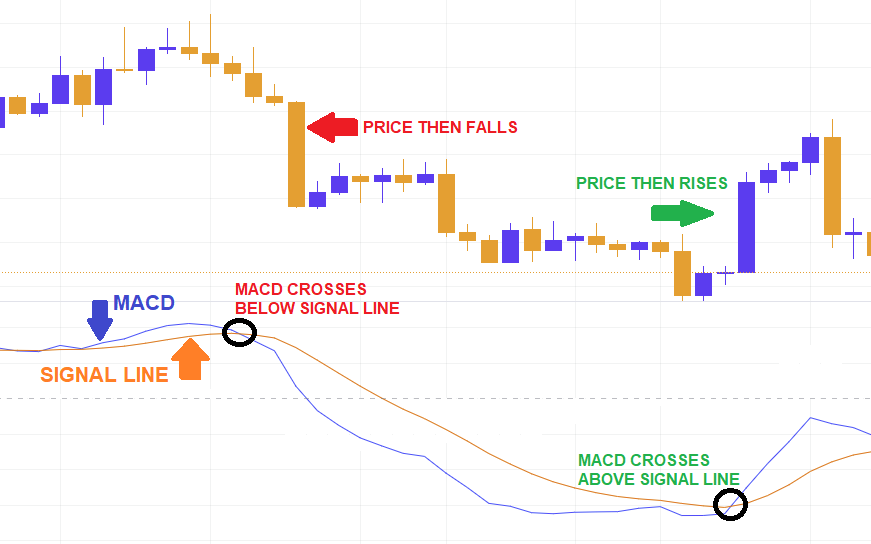
The result of that calculation is the MACD line. A nine-day EMA of the MACD called the “signal line,” is then plotted on top of the MACD line, which can function as a trigger for buy and sell signals.
Traders may buy the asset when the MACD crosses above its signal line and sell—or short—the asset when the MACD crosses below the signal line. MACD indicators can be interpreted in several ways, but the more common methods are crossovers, divergences, and rapid rises/falls. As the below example illustrates, the MACD can serve as an extremely useful signal of when to enter and exit trades.
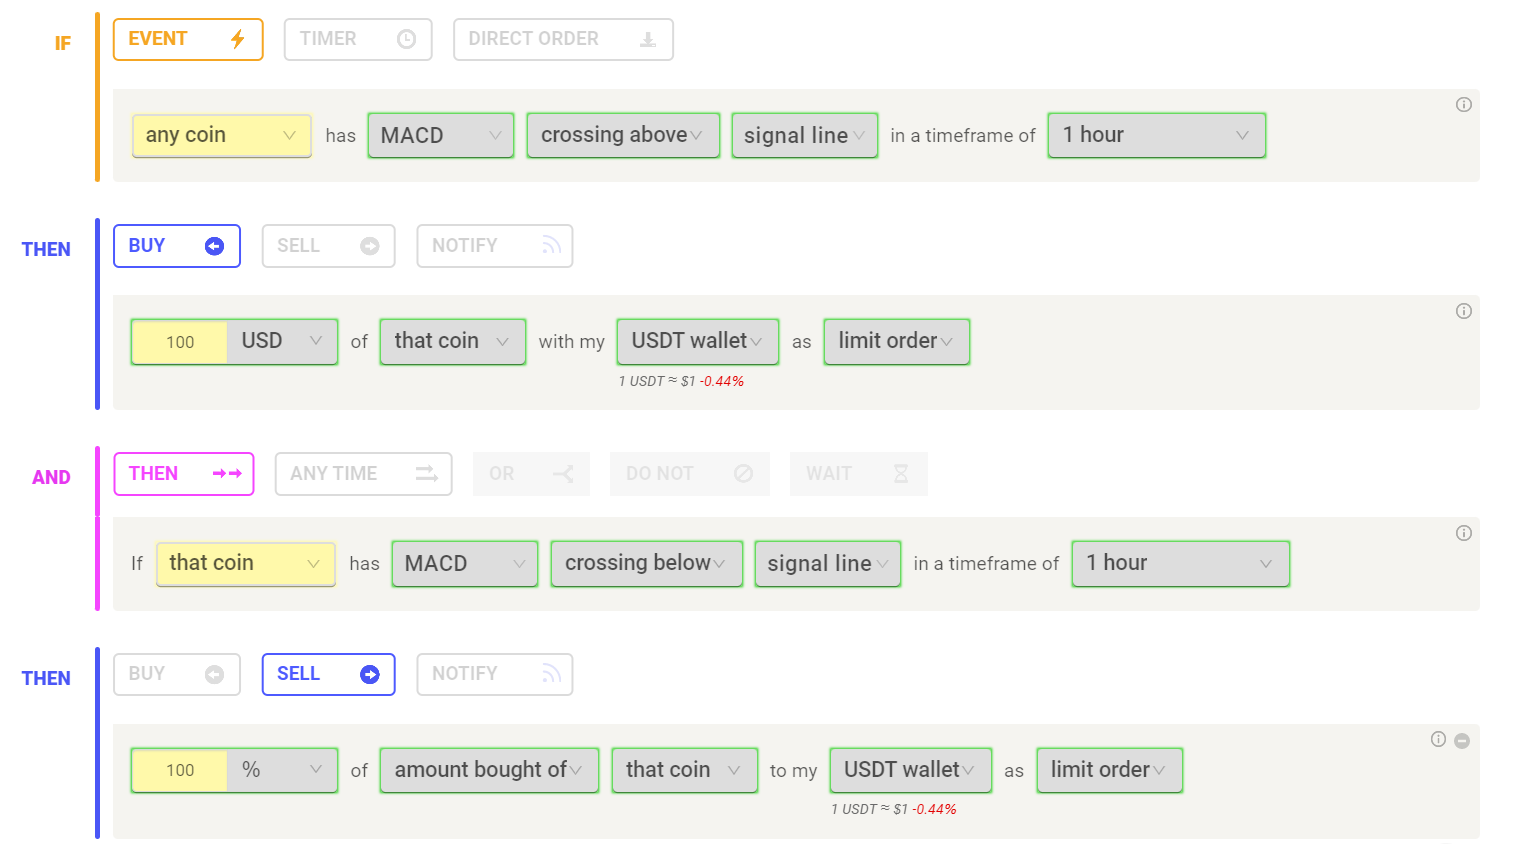
Below is an example strategy using MACD while trading on Coinrule and other sample prebuilt strategies using MACD can be found in our Template Library:
We hope you enjoy the new indicator. Happy trading!