Technical Indicators
Last updated November 4, 2024
Introduction To Technical Indicators On Coinrule
An automated trading strategy takes decisions based on indicators and triggers that signal when it's the best time to buy or sell a coin.
What Is a Technical Indicator?
Technical indicators are heuristic or pattern-based signals produced by the price, volume, and/or open interest of a security or contract used by traders who follow technical analysis.
By analyzing historical data, technical analysts use indicators to predict future price movements. Examples of common technical and effective technical indicators include the Relative Strength Index (RSI), Moving Averages , Money Flow Index (MFI), moving average convergence divergence (MACD), and Bollinger Bands® .
Technical indicators are mathematical ideals and methodologies applied to asset prices that provide meaningful information regarding the trend. Is it weakening? Is it strengthening? These are valuable information that can make a trading system very profitable.
Examples of very common and effective technical indicators traders use are the Relative Strength Index (RSI) and the Moving Averages .
Interpreting Technical Indicators
It is important to know that technical indicators are not the same as trading strategies, they are tools used in creating trading strategies.
Apart from the subjective interpretation of signals generated by indicators, their mathematical formula or the setup can be adjusted by an experienced trader to provide profitable results.
A common trading tip is to calculate indicators starting from the asset's closing price in a specific period (according to the selected time frame). Then, the trader considers only signals generated by "closing prices."
Wait for Price Confirmation
Using closed prices avoids false signals and ensures that your rule executes upon a confirmation. This prevents your rule from executing on every single volatile move which can be caused by outliers, such as, a relatively large market order causing price and intra-timeframe indicator values to spike.
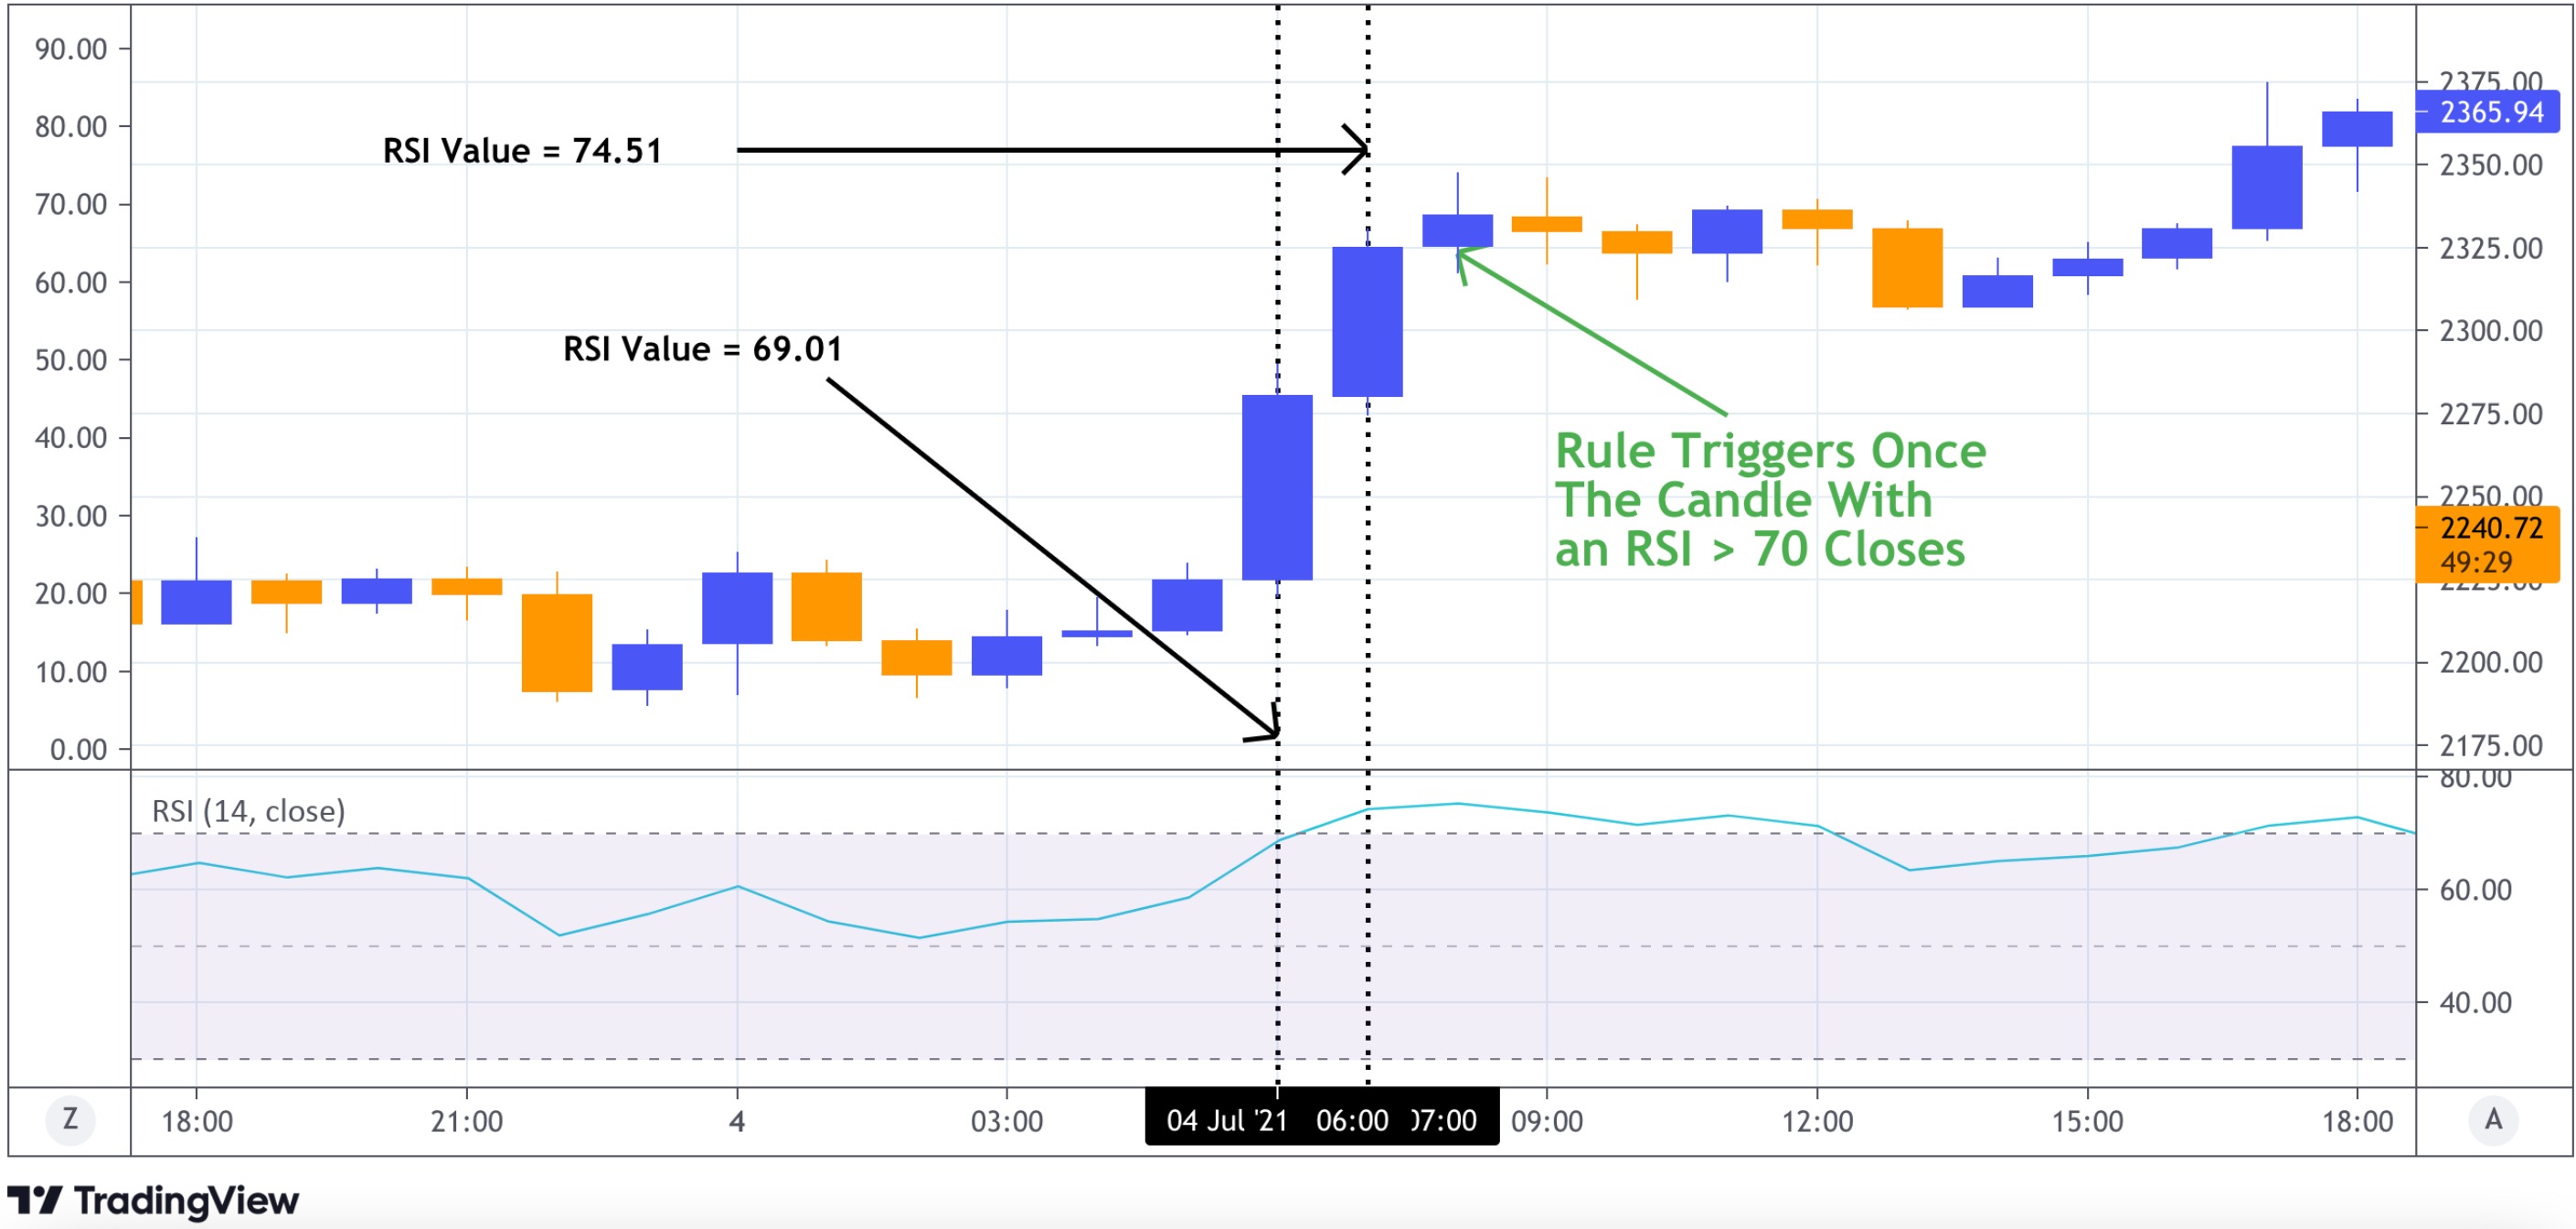
If your rule is set to sell if the RSI reaches 70 on the 1-hour timeframe, the bot needs a value greater than 70 and confirmed by the closing a candle to trigger the order.
Once the candle closes, and the RSI is confirmed, that is valid until a new candle closes. As an example, selecting a time frame of 1-hour results in each sequential RSI value to be valid for 1 hour.
The system does not consider values of RSI calculated from real-time trades. That would result in different indicator values very frequently, potentially causing over-reaction to every price move.
Over-reacting to a price move is typical error traders do with manual trading. Respecting the strict rule of relying on confirmations is one of the main advantages of running an automated trading strategy, excluding emotions from the decision-making process.
To learn more about how technical indicators are used on Coinrule, kindly visit our Technical FAQ page https://atlas-kb.com/atlas-sbw870763c/categories/980014-technical-faq