Ride The Trend
Last updated November 4, 2024
Introducing the 'Ride The Trend' Template
The Relative-Strength Index (RSI) is a technical indicator that measures the magnitude of a coin's price moves. High values indicate that the price is going up quickly. Lower values, on the contrary, signal that the price is dropping.
Cryptocurrencies can experience sudden and sharp uptrends, and the RSI is a useful tool to find them. The rule spots the coins on a strong trend as their price could increase even more.
How it works
In theory, an RSI above 70 means that the coin's price already increased significantly and, thus, it could be a good time for selling. On the other hand, the RSI of cryptocurrencies may remain at high values for an extended period.
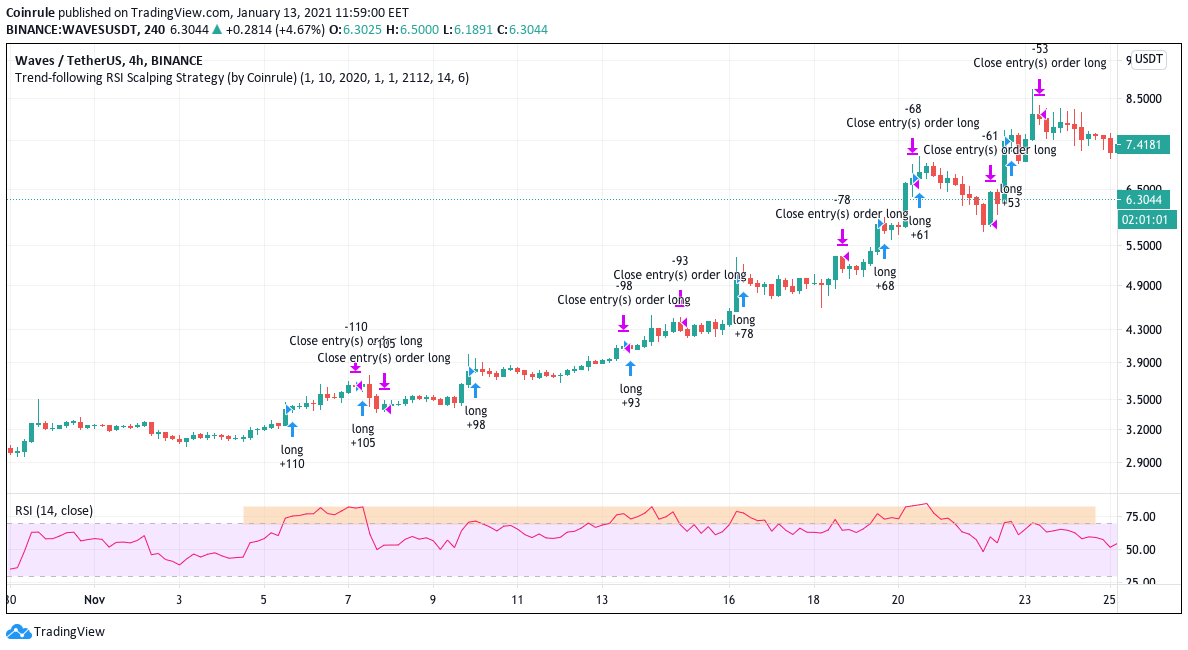
In the example below, the RSI of Waves stays above 60, and often above 70, for almost one month. Buying and selling on the way up would have provided excellent opportunities.
Pro-tip: you can run this rule in every market condition. In times of market downtrend, rarely the RSI will be at high values, so that the strategy will wait for more convenient market conditions before opening new trades.
Avoid pump-and-dumps
The RSI must be above 70 in a time frame of 4-hours (i.e., looking at the 4-hr chart) to open the position. That means that the strategy buys coins that are on solid uptrends, avoiding short-term pump-and-dumps, where the risk of buying the top is very high.
The best time frame for this strategy is the 4-hr. Other time frames are not advisable.
Close your trades
The strategy sells the coins if the price increases 6% from the entry price. Alternatively, it closes the position if the RSI drops below 55, indicating a possible weakening of the trend.
The rule can only buy one coin at a time with the default setup. If you want to open multiple trades simultaneously, you can use the Any Time Operator .
This strategy made 57.89% net profit on ETH/USDT on the 4Hour timeframe from January 2022 - November 2022.
Backtest the strategy on Tradingview
You can backtest this strategy using this trading script published on Tradingview. You can test the results on historical data, selecting the coin of your choice, and adjusting the parameters to fit even better your needs.
This is a guide to learn how to backtest strategies on Tradingview.
Try out the Ride the Trend Strategy now on Coinrule to maximize your profits and returns!


