Crypto Charts For Beginners: Understanding Candlestick Patterns
Last updated November 5, 2024
Understanding Candlestick Patterns
Anticipating market moves is the backbone of any trading strategy. Traders need to have an understanding of where the trend is heading, and if there are any signals that show that the trend is changing. Crypto charts are essential tools for beginners.
Crypto charts provide valuable insight into the trend of an asset. Reading properly specific patterns helps beginners improving the returns of their strategies significantly. Looking closely at a price on a crypto chart allows traders to fine-tune their trading system. There are several types of candlestick patterns. Recognizing them enables even beginner traders to get a better idea of the upcoming direction of the asset.
The best way to look at the crypto chart is to analyze the trend from a medium or long-term perspective. A chart set on a daily or weekly time frame is an ideal starting point before zooming in and taking more specific conclusions.
Chart patterns that form on higher time frames are much more reliable, and you can use them to start an automated trading strategy based on the signal provided.
Bullish Reversal Patterns
Hammer

The hammer is a 1-candle pattern
Characteristics to look for on the crypto chart:
- Price closing at the top quarter of the range
- The lower shadow is two or three times the length of the body
- A hammer is a bullish reversal pattern that forms after a decline in price.
What does it exactly mean?
Once the market opened a large number of token holders sold, pushing the price down, however before the candle closed, buying momentum pushed the price back higher.
This momentum was so strong that the closing price finished above the opening price.
The hammer signifies a bullish reversal and shows that the buyers are coming in strong into the market.
Bullish Engulfing Pattern

Characteristics to look for on the crypto chart:
- The first candle is bearish while the second candle is bullish.
- The body of the second candle completely overwhelms and covers the first candle.
What does the pattern mean?
When looking at a crypto chart, this pattern shows that the seller’s momentum in the first candle was overtaken by buying power of the bulls, who then pushed the price up.
The pattern when printed on a crypto chart indicates that the trend is reversing and becoming bullish.
Morning Star

A morning star is a 3-candle bullish reversal pattern which forms after a decline in the price.
Characteristics to look for on the crypto chart:
- The first candle is bearish in nature.
- The second candle has an extremely small range.
- The third candle exhibits an aggressive upwards momentum.
Why does it do that?
Sellers push down the price in the first candle, buying and selling power are even in the second candle, and in the third candle, Sellers are exhausted and buyers push the price up.
Observing the morning star pattern on a crypto chart, tells you that the sellers have been exhausted after fighting with the buyers and the market is now bullish.
Bearish Reversal Patterns
Shooting Star

The shooting star is a 1-candle bearish reversal pattern.
Characteristics to look for on the crypto chart:
- Little to no lower shadow.
- Price closes at the bottom quarter of the range.
- The upper shadow is about double the length of the body
What does the pattern mean?
There was a lot of buying pressure at the open of the market that pushed the price up, however before the candle close there was huge selling pressure pushing the price down.
This pattern when printed on the crypto chart signals a bearish reversal and shows that the selling pressure is strong in the market.
Bearish Engulfing Pattern

A Bearish Engulfing Pattern is a 2-candle bearish reversal candlestick pattern.
Characteristics to look for on the crypto chart:
- The first candle is bullish.
- The second candle is bearish and large enough to overtake the first candle.
What does this mean?
Buying momentum is in the first candle, but the selling pressure overwhelms and prints a lower low.
The Bearish Engulfing Pattern shows that the sellers have overwhelmed the buyers and are now have momentum.
Evening Star

An Evening Star is a 3-candle bearish reversal candlestick pattern.
Characteristics to look for on the crypto chart:
- The first candle has a bullish close.
- The second candle has a small range.
- The third candle has a strong bearish close.
What does this pattern mean?
We see that in the first candle buyers have more momentum, closing the candle with a higher price. This is followed by a candle where there are equal buying and selling pressure. Eventually, the bears take over and push the price down.
The Evening Star tells you the buyers are exhausted and the sellers are momentarily in control.
Hammer

The hammer is a 1-candle pattern
Characteristics:
- Price closing at the top quarter of the range
- The lower shadow is two or three times the length of the body
- A hammer is a bullish reversal pattern that forms after a decline in price.
What does it exactly mean?
Once the market opened a large number of token holders sold, pushing the price down, however before the candle closed, buying momentum pushed the price back higher.
This momentum was so strong that the closing price finished above the opening price.
The hammer signifies a bullish reversal and shows that the buyers are coming in strong into the market.
Bullish Engulfing Pattern

Characteristics:
- The first candle is bearish while the second candle is bullish.
- The body of the second candle completely overwhelms and covers the first candle.
What does the pattern mean?
This shows that the seller’s momentum in the first candle was overtaken by buying power of the bulls, who then pushed the price up.
This benefit of this pattern is to show that the buying momentum is increasing stronger.
Morning Star

A morning star is a 3-candle bullish reversal pattern which forms after a decline in the price.
Characteristics:
- The first candle is bearish in nature.
- The second candle has an extremely small range.
- The third candle exhibits an aggressive upwards momentum.
Why does it do that?
Sellers push down the price in the first candle, buying and selling power are even in the second candle, and in the third candle, Sellers are exhausted and buyers push the price up.
The morning star pattern tells you that the sellers have been exhausted after fighting with the buyers and the market is now bullish.
Bearish Reversal Patterns
Shooting Star

The shooting star is a 1-candle bearish reversal pattern.
Characteristics:
- Little to no lower shadow.
- Price closes at the bottom quarter of the range.
- The upper shadow is about double the length of the body
What does the pattern mean?
There was a lot of buying pressure at the open of the market that pushed the price up, however before the candle close there was huge selling pressure pushing the price down.
This pattern signals a bearish reversal and shows that the selling pressure is strong in the market.
Bearish Engulfing Pattern

A Bearish Engulfing Pattern is a 2-candle bearish reversal candlestick pattern.
Characteristics:
- The first candle is bullish.
- The second candle is bearish and large enough to overtake the first candle.
What does this mean?
Buying momentum is in the first candle, but the selling pressure overwhelms and prints a lower low.
The Bearish Engulfing Pattern shows that the sellers have overwhelmed the buyers and are now have momentum.
Evening Star

An Evening Star is a 3-candle bearish reversal candlestick pattern.
Characteristics:
- The first candle has a bullish close.
- The second candle has a small range.
- The third candle has a strong bearish close.
What does this pattern mean?
We see that in the first candle buyers have more momentum, closing the candle with a higher price. This is followed by a candle where there are equal buying and selling pressure. Eventually, the bears take over and push the price down.
The Evening Star tells you the buyers are exhausted and the sellers are momentarily in control.
Final Remarks
Understanding Candlestick patterns can be an excellent source of data for traders to build their strategies. This can then be utilized to pick the best strategy that would perform during these market conditions.
If a bearish pattern were to print, this would indicate a change in the trend and a possible correction in price. If we intend on using this data to create a strategy we would want to take advantage of short-term corrections. An optimal rule for this scenario can be seen below.
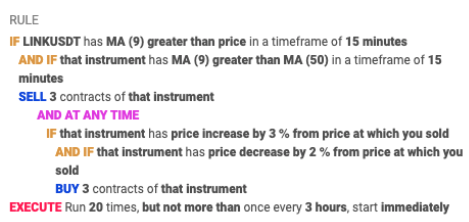
The rule is structured to open a short position on ChainLink if the MA (9) is lower than MA(50) and if the MA(9) is greater than the price during the same timeframe. By spotting a trend reversal, and placing a rule such s this in place we can benefit from short-term corrections.