Trading & Shorting in Bear Markets
Last updated November 4, 2024
How To Trade & Short in a Bear Market
The definition of a bear market is when a market experiences an extended downtrend, commonly over 20%, for a period of at least two months. This definition is fit for traditional markets where the volatility is lower. For crypto, a 20% decline is seen as a slight dip and can be experienced over a few days without major amounts of cortisol entering your bloodstream. Typical bear markets see bitcoin retrace between 80-90% and altcoins up to 99% and usually last between 6 months and 2 years, depending on the macroeconomic environment.
Across bitcoin’s history, it is estimated to have had 42% down days, where the price closed lower than where it opened. For this reason, it is essential to understand how to profit from downtrends and not always have a bullish bias. When understood, bear markets provide the perfect opportunity to profit from selling and buying back lower - also known as short-selling.
How to Build Bear Market Rules
When analysing price during a bear market, you are keeping an eye out for where good places to sell and rebuy, with the aim is to invert the system you use during a bull market. “Buy low, sell high” becomes “Sell high, buy low”. "Long support" and "sell resistance" becomes "short resistance" and "buy support". This same philosophy can also be carried over to indicators.
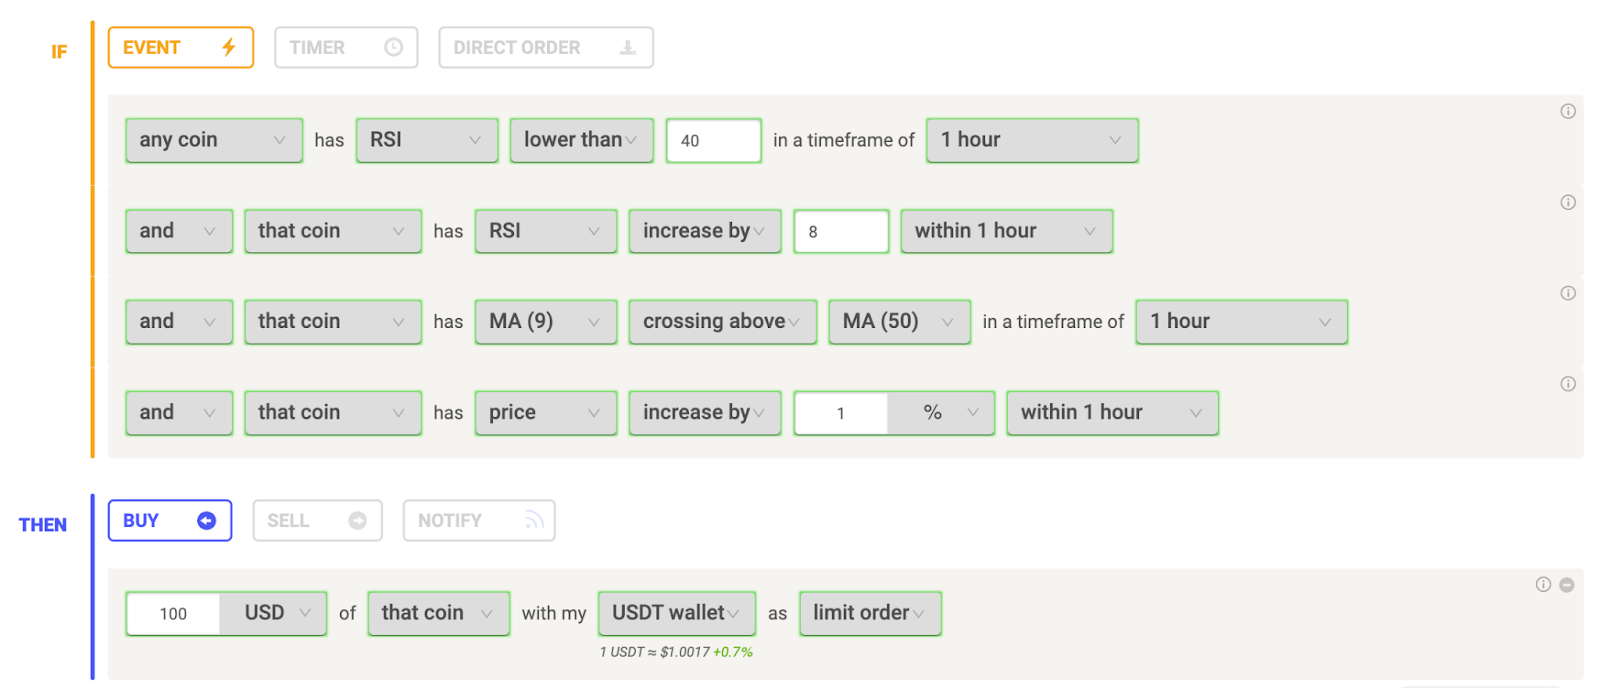
In a bull market your strategy may have been based on the 1-hour timeframe and bought when the following conditions were met:
- RSI is below 40 and near oversold territory
- RSI has increased by 8 within 1 hour
- MA 9 has crossed above the MA 50
- Price has increased by 1% within 1 hour
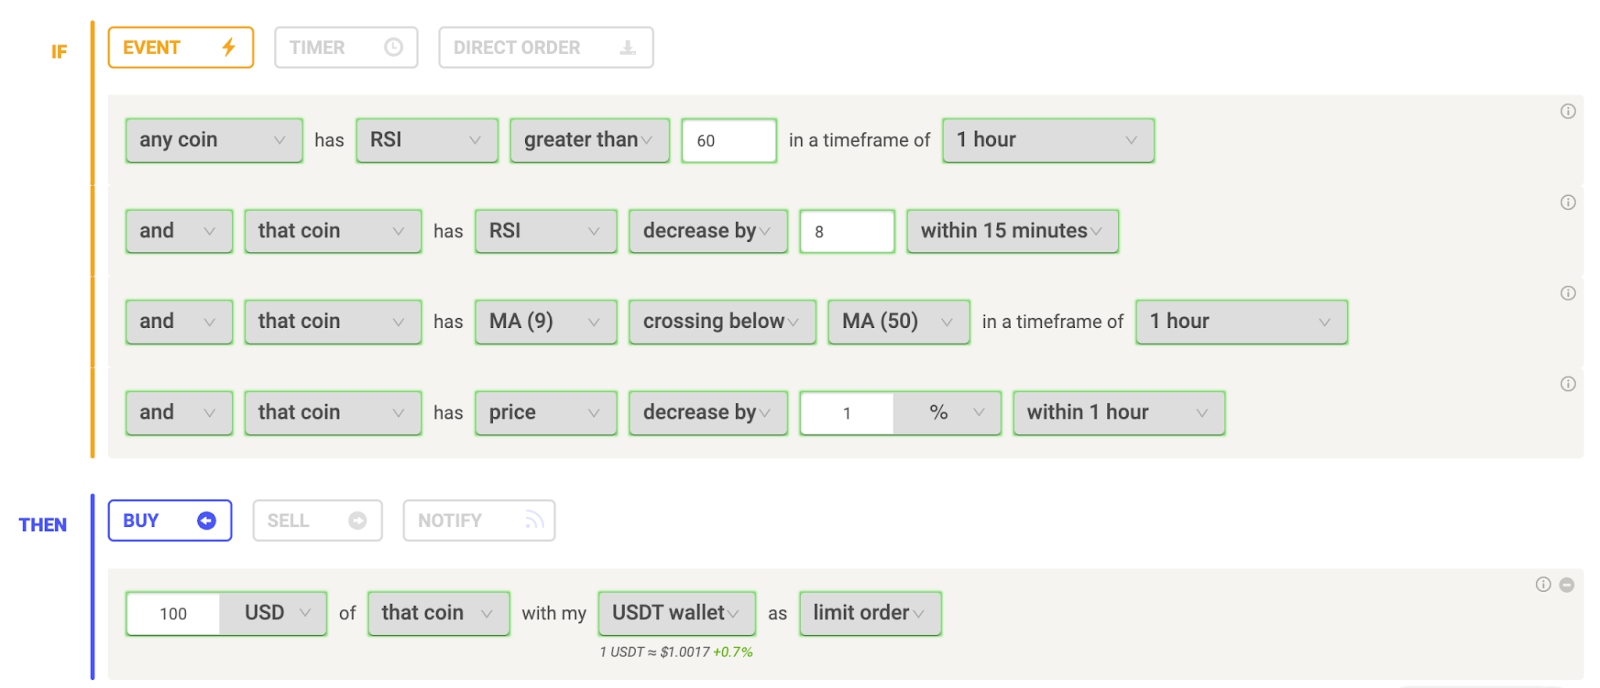
During a bear market, you could use the same system but invert these values and sell first instead of buying.
The conditions for this strategy then become:
- Sell when RSI is above 60 and near overbought
- RSI has decreased by 8 within 1 hour,
- MA 9 has crossed below MA 50,
- Price has decreased by 1% within 1 hour.
Futures Markets
Accessing and trading futures markets enables you to short assets without having to own the underlying asset. This increases profits as it prevents you from having to hold coins that you ultimately believe will trend down - leading to the profits only mitigating losses from holding.
Futures also provides you access to leverage where you can increase your capital efficiency and overall exposure to the market. Leverage should only be used if the implications of increasing your position size are understood. Stop losses and effective risk management should also be used to prevent substantial losses from taking place.
Confirmation of a Strong Trend
Price and Volume
Volume is another useful indicator that ensures trends are strong. It could be argued that one of the most important and fundamental indications of a breakout or breakdown is price and volume.
There is a saying that “price follows volume”, and suggests that when a strong increase in volume is followed by an uptrend or downtrend in price, it is a clear indication of a strong trend. When this occurs during a downtrend it showcases there is true excess supply for the asset and a large quantity of selling. This opposes a low number of buying that can be overcome more easily which occurs when volume does not decrease substantially.
Moving Averages
Moving averages can also be used to prevent your rule from trading when the market conditions are not trending in the direction you are trading. Moving averages can act as resistances during a bear market, with an indication of a downtrend being a shorter-term moving average being below a longer-term moving average. This illustrates that the most recent price has been lower than the price further in the past, meaning a downtrend has occurred.
Using key moving averages, such as the 100-hour, can also prevent your rules from buying or selling when the trend is against the rule setup you are using. The chart below of Ethereum showcases the increased probability of your rule not trading against the trend when you use moving averages.

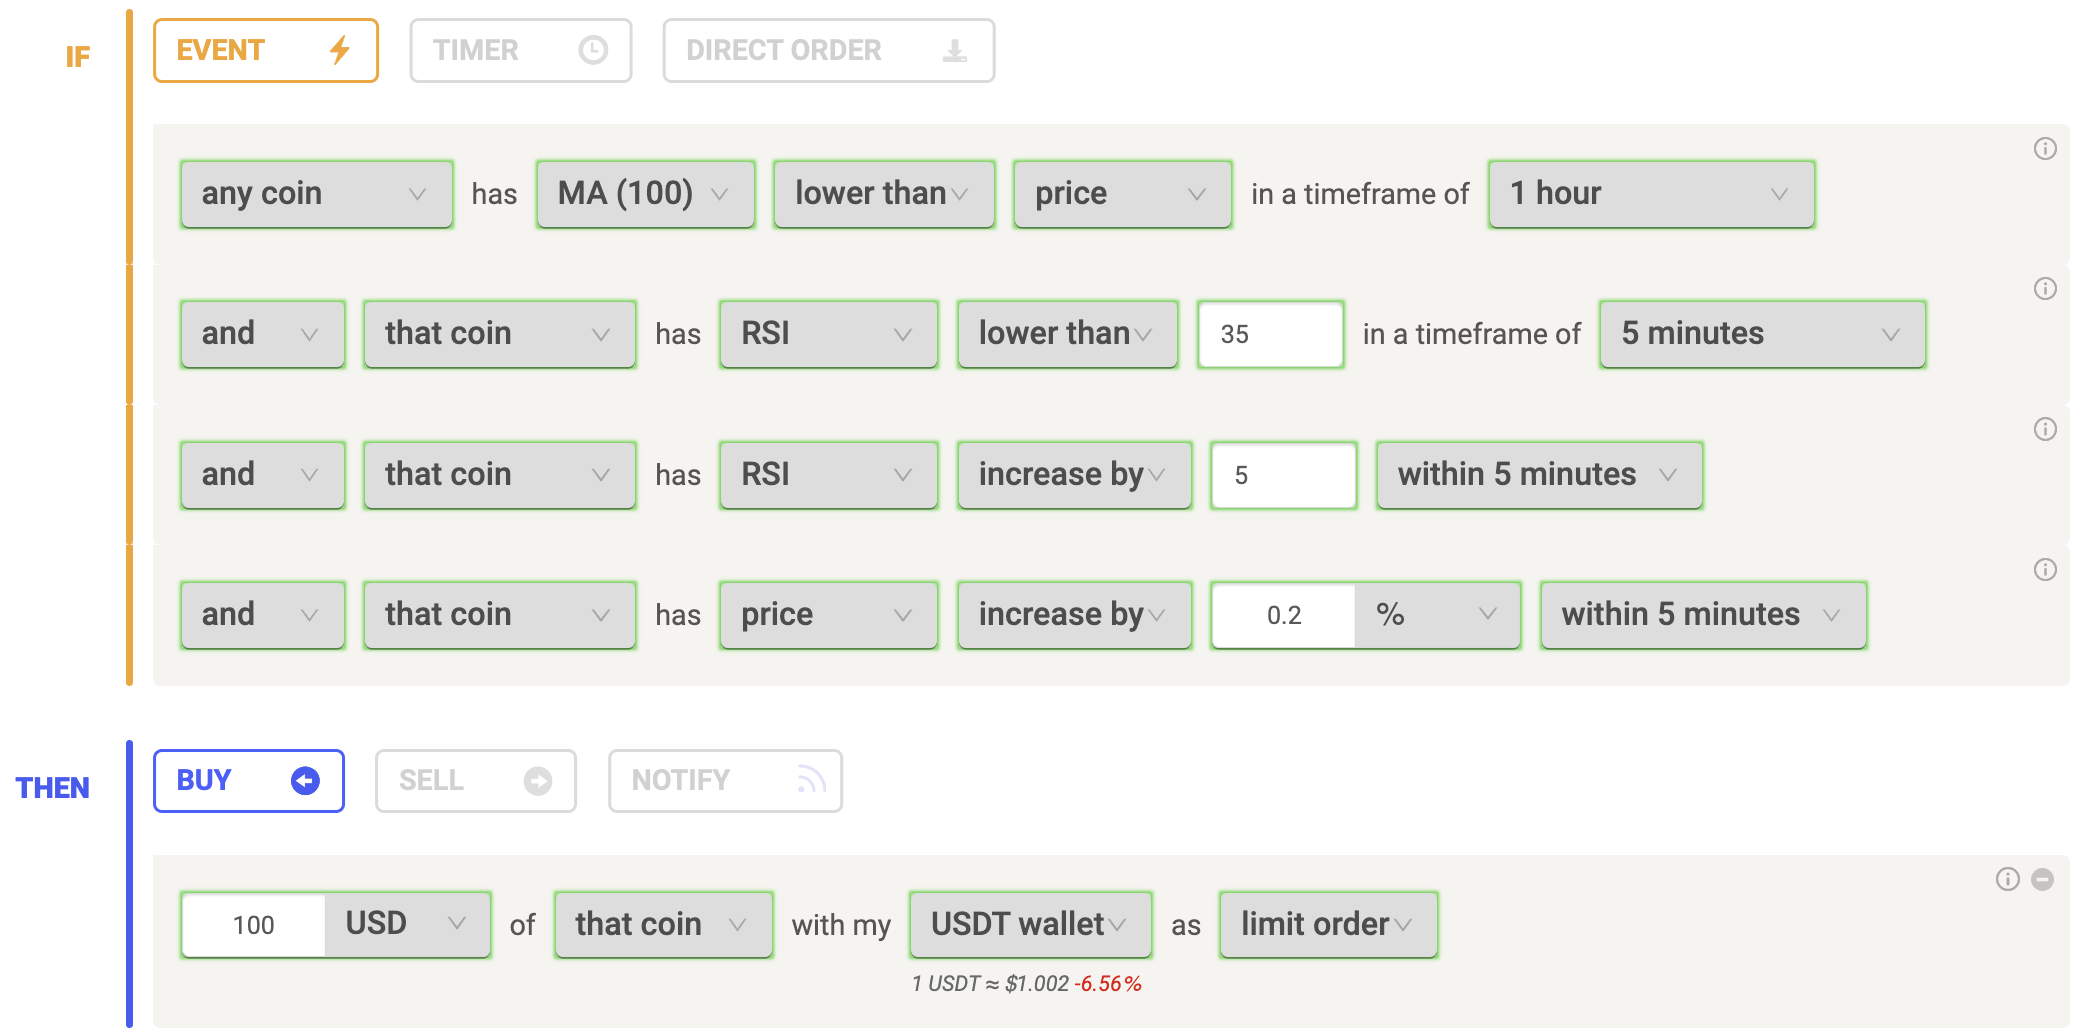
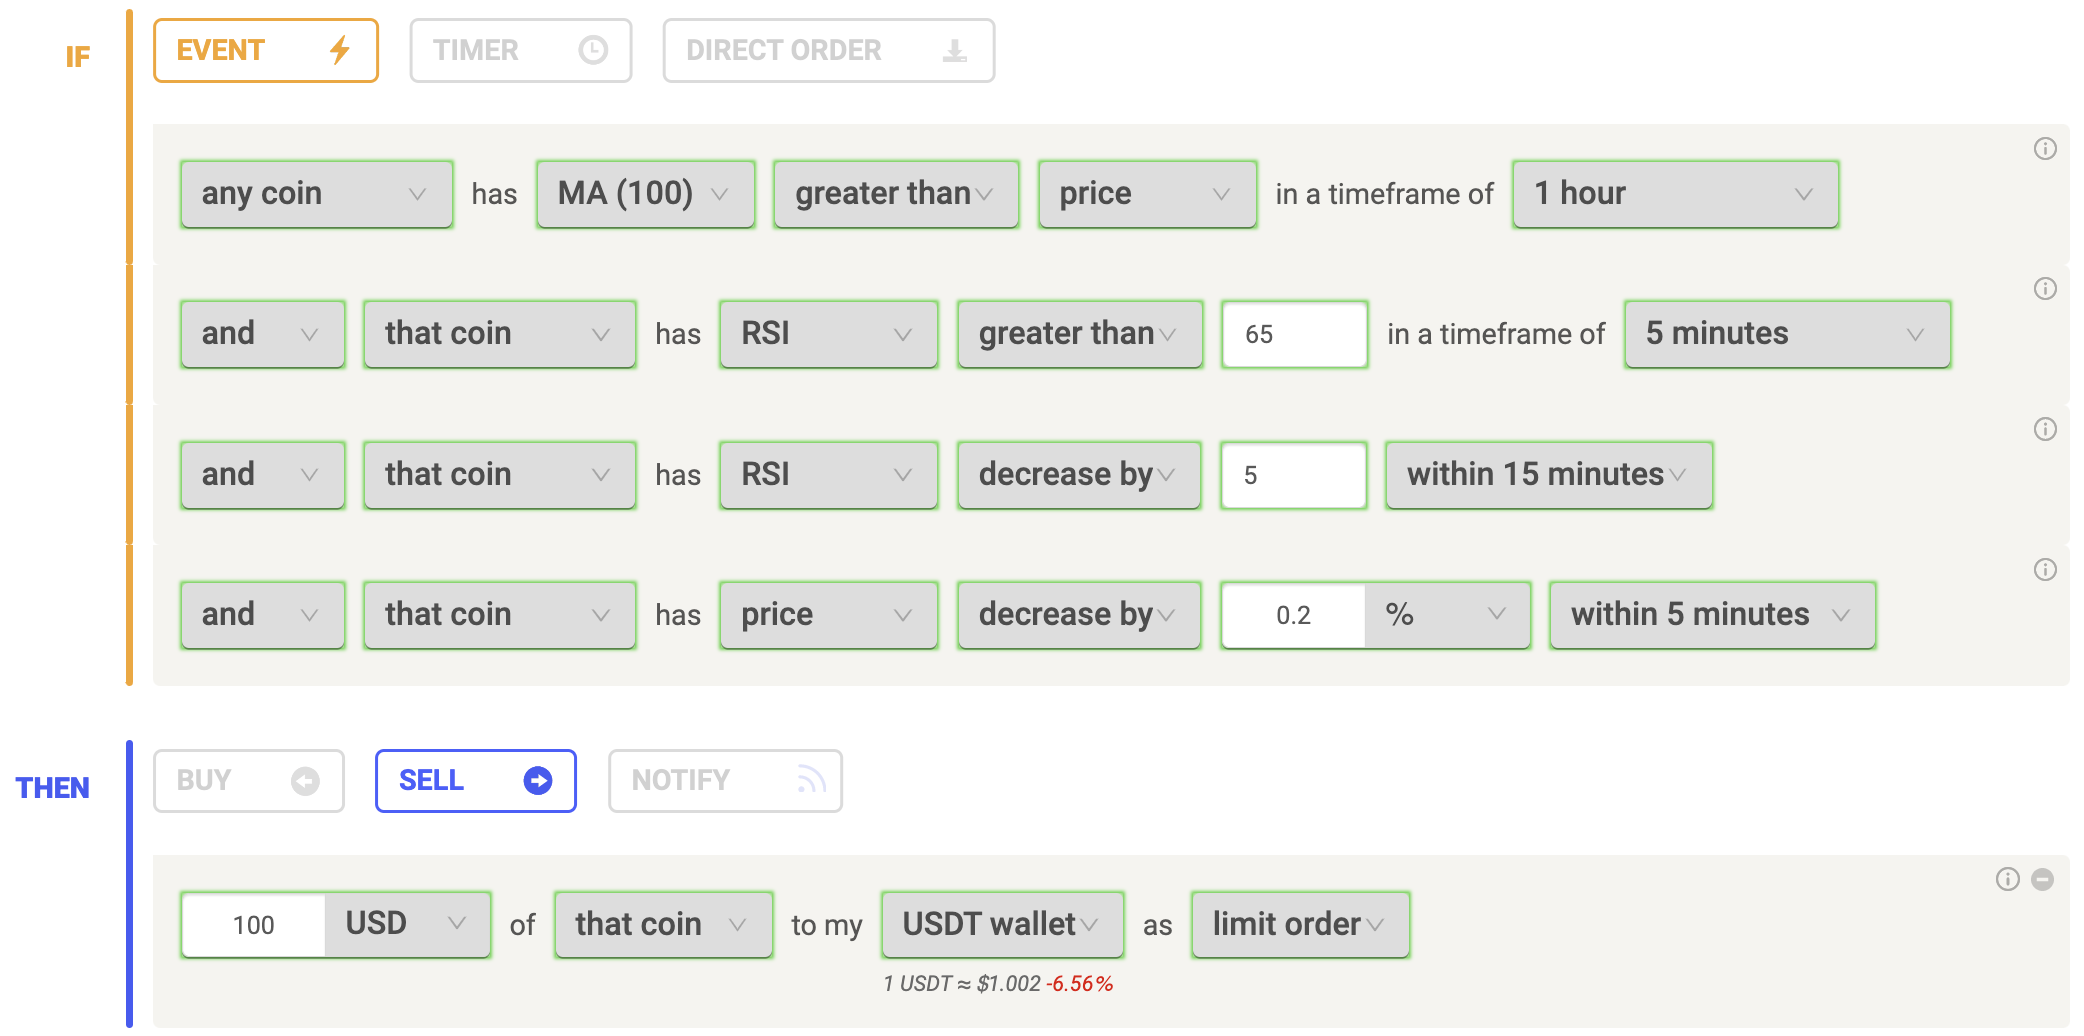
To prevent your rules that are based on longing from buying when there is a downtrend, you can set a condition to only buy if the price is above the MA 100 in a 1-hour timeframe (orange line). The inverse can be applied to rules that are focused on shorting, where coins can only be sold if the price is below the MA 100 in a 1-hour timeframe.
The entries below showcase how you can set up your rules to follow this principle. These two rules could also be run in parallel to ensure you are profiting when the market is trending up or down. Once the MA 100 is lower than price, your rule will looks for longs. When the MA 100 is greater than price, your rule will look for shorts.
Moving Average Trend Protection for Bullish Conditions (Long)
Moving Average Trend Protection for Bearish Conditions (Short)
Relative Strength Index
The relative strength index (RSI) is an indicator that focuses on the momentum of an asset. The RSI value ranges from 0 to 100, with a value under 30 being considered oversold and a value above 70 considered overbought. When RSI is fluctuating around the 50 value, the RSI is considered reset and the price of the asset is detailed as "fair value" for the relative timeframe. The RSI can be used as confirmation of a strong trend occurring as it measures the buying or selling pressure over the past 14 periods.
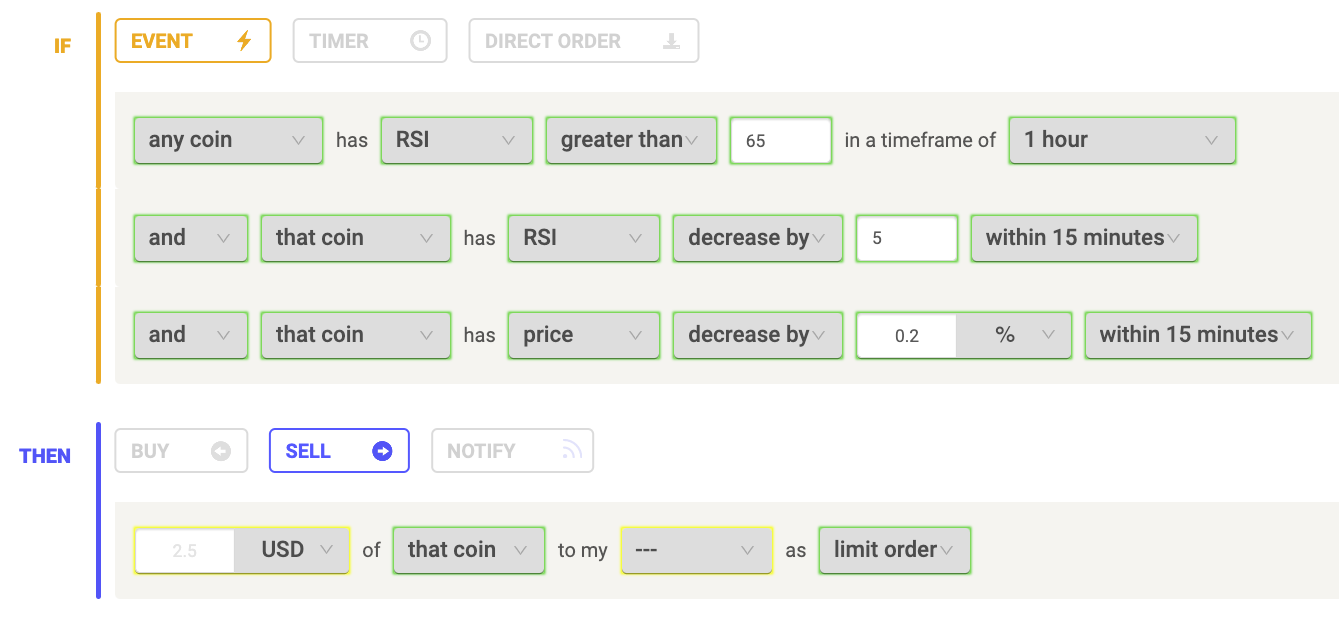
The RSI can also be used to predict the reversal of a trend - potentially providing lucrative trade entries. If RSI is trading above 70, the price of the asset is considered overvalued relative to the previous 14 periods. This can be an area where price may encounter an overpowering amount of sellers where supply will exceed demand - causing the price to decline back to fair value. A sharp decline in RSI illustrates that the momentum of the asset has shifted, with sellers now being in control. This can also provide another confirmation that the price of an asset is reversing. The rule below aims to act on this principle.
Wait For
Another useful feature that can be used to confirm a trend or a reversal, is the “Wait For” function. This allows your rule to only proceed to buying or selling once a period of time has passed between one condition being met and another.
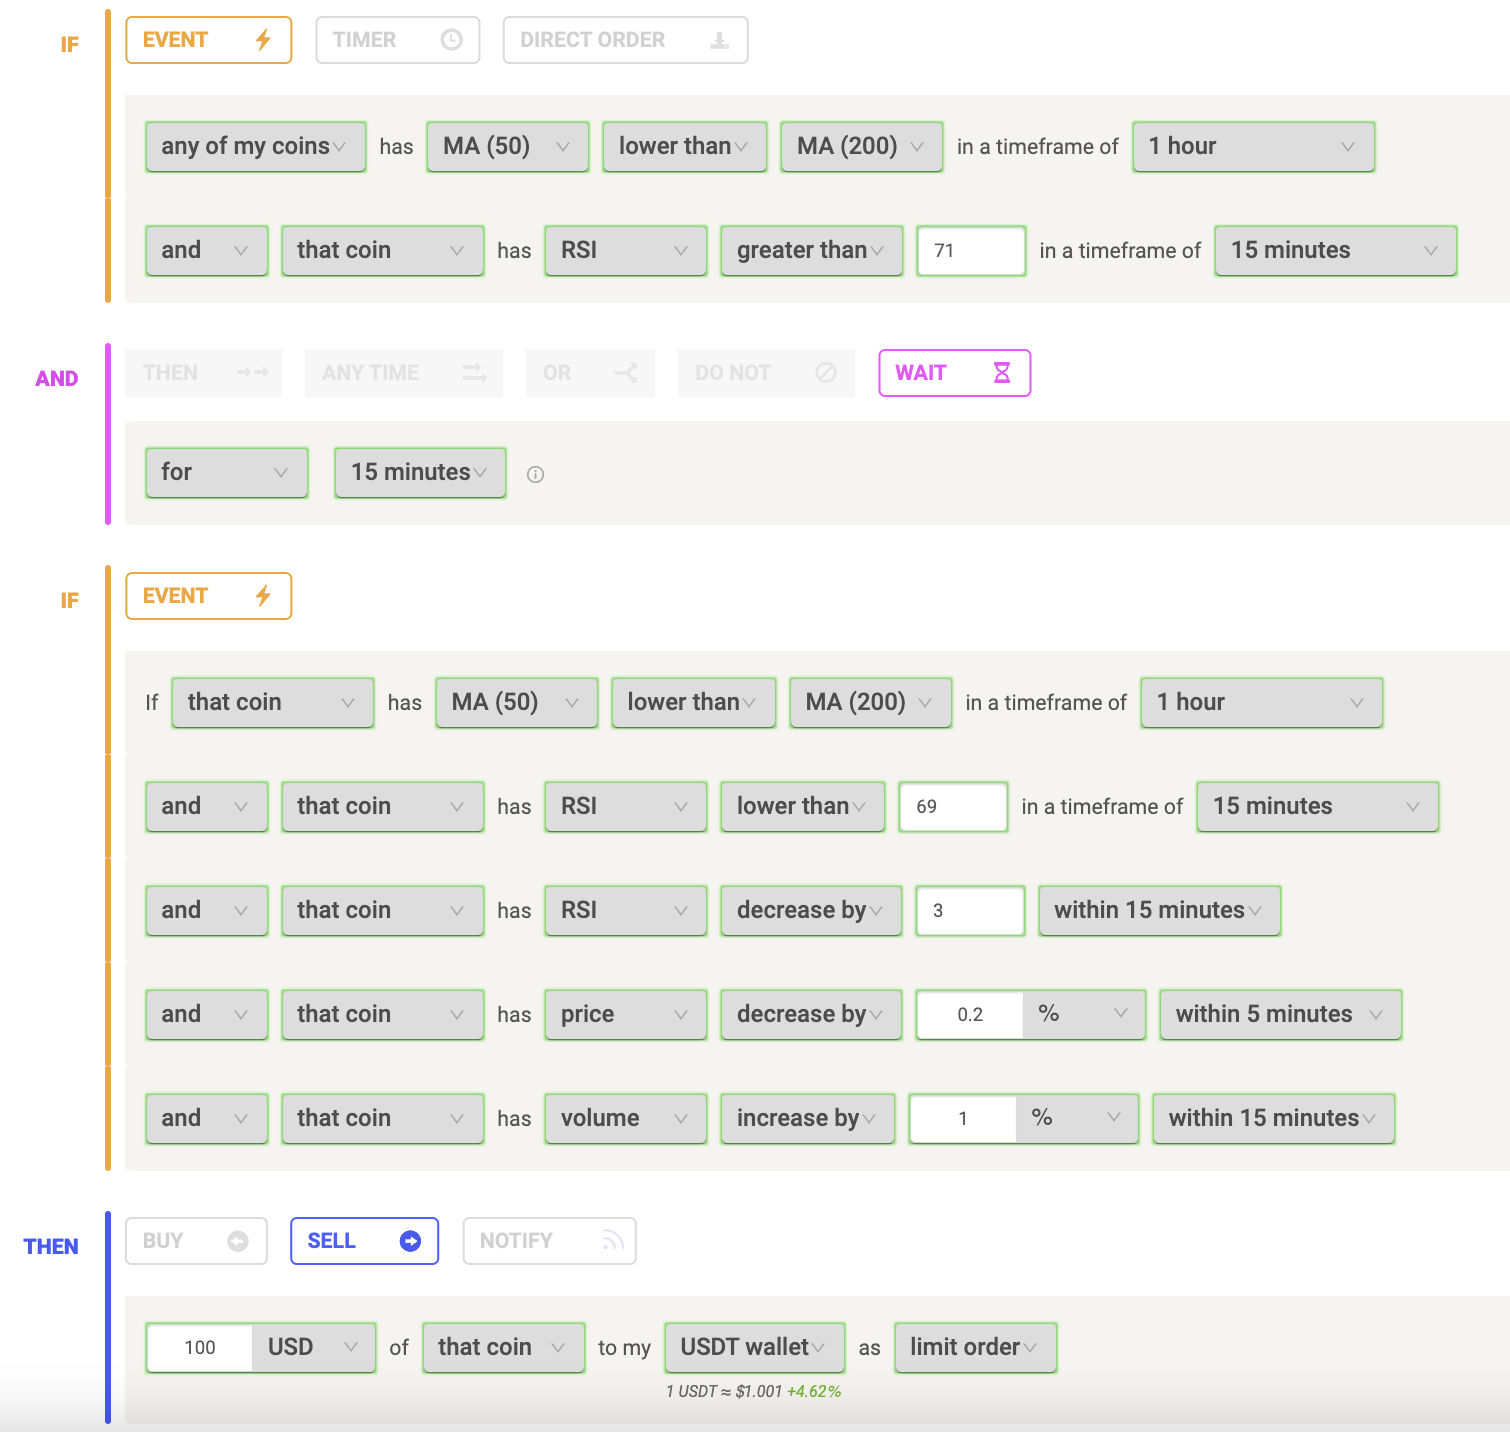
Below is an example of the entry to a rule that features several confirmations that a downtrend is taking place.
Risk and Reward in a Bear Market
As the macro trend of the majority of asset classes is their prices increasing, due to the effects of inflation increasing asset prices, bear markets generally provide inferior profit potential compared to bull markets, when position sizing is constant. This is due to the risk-reward of shorting being lower compared to longing. For example, the potential net gain from a short can only be 100% as an asset depreciates to 0. However, the potential net gain from longing can be much higher than 100%, especially in crypto.
If the market goes against your position when you are long with no leverage and you do not cut your losses, you have a maximum drawdown of 100% of the amount you have allocated to that trade. When you are short, with the same parameters, your potential downside is not capped and theoretically could be infinite as you miss out on the potential profit made from the asset appreciating more than 100%.
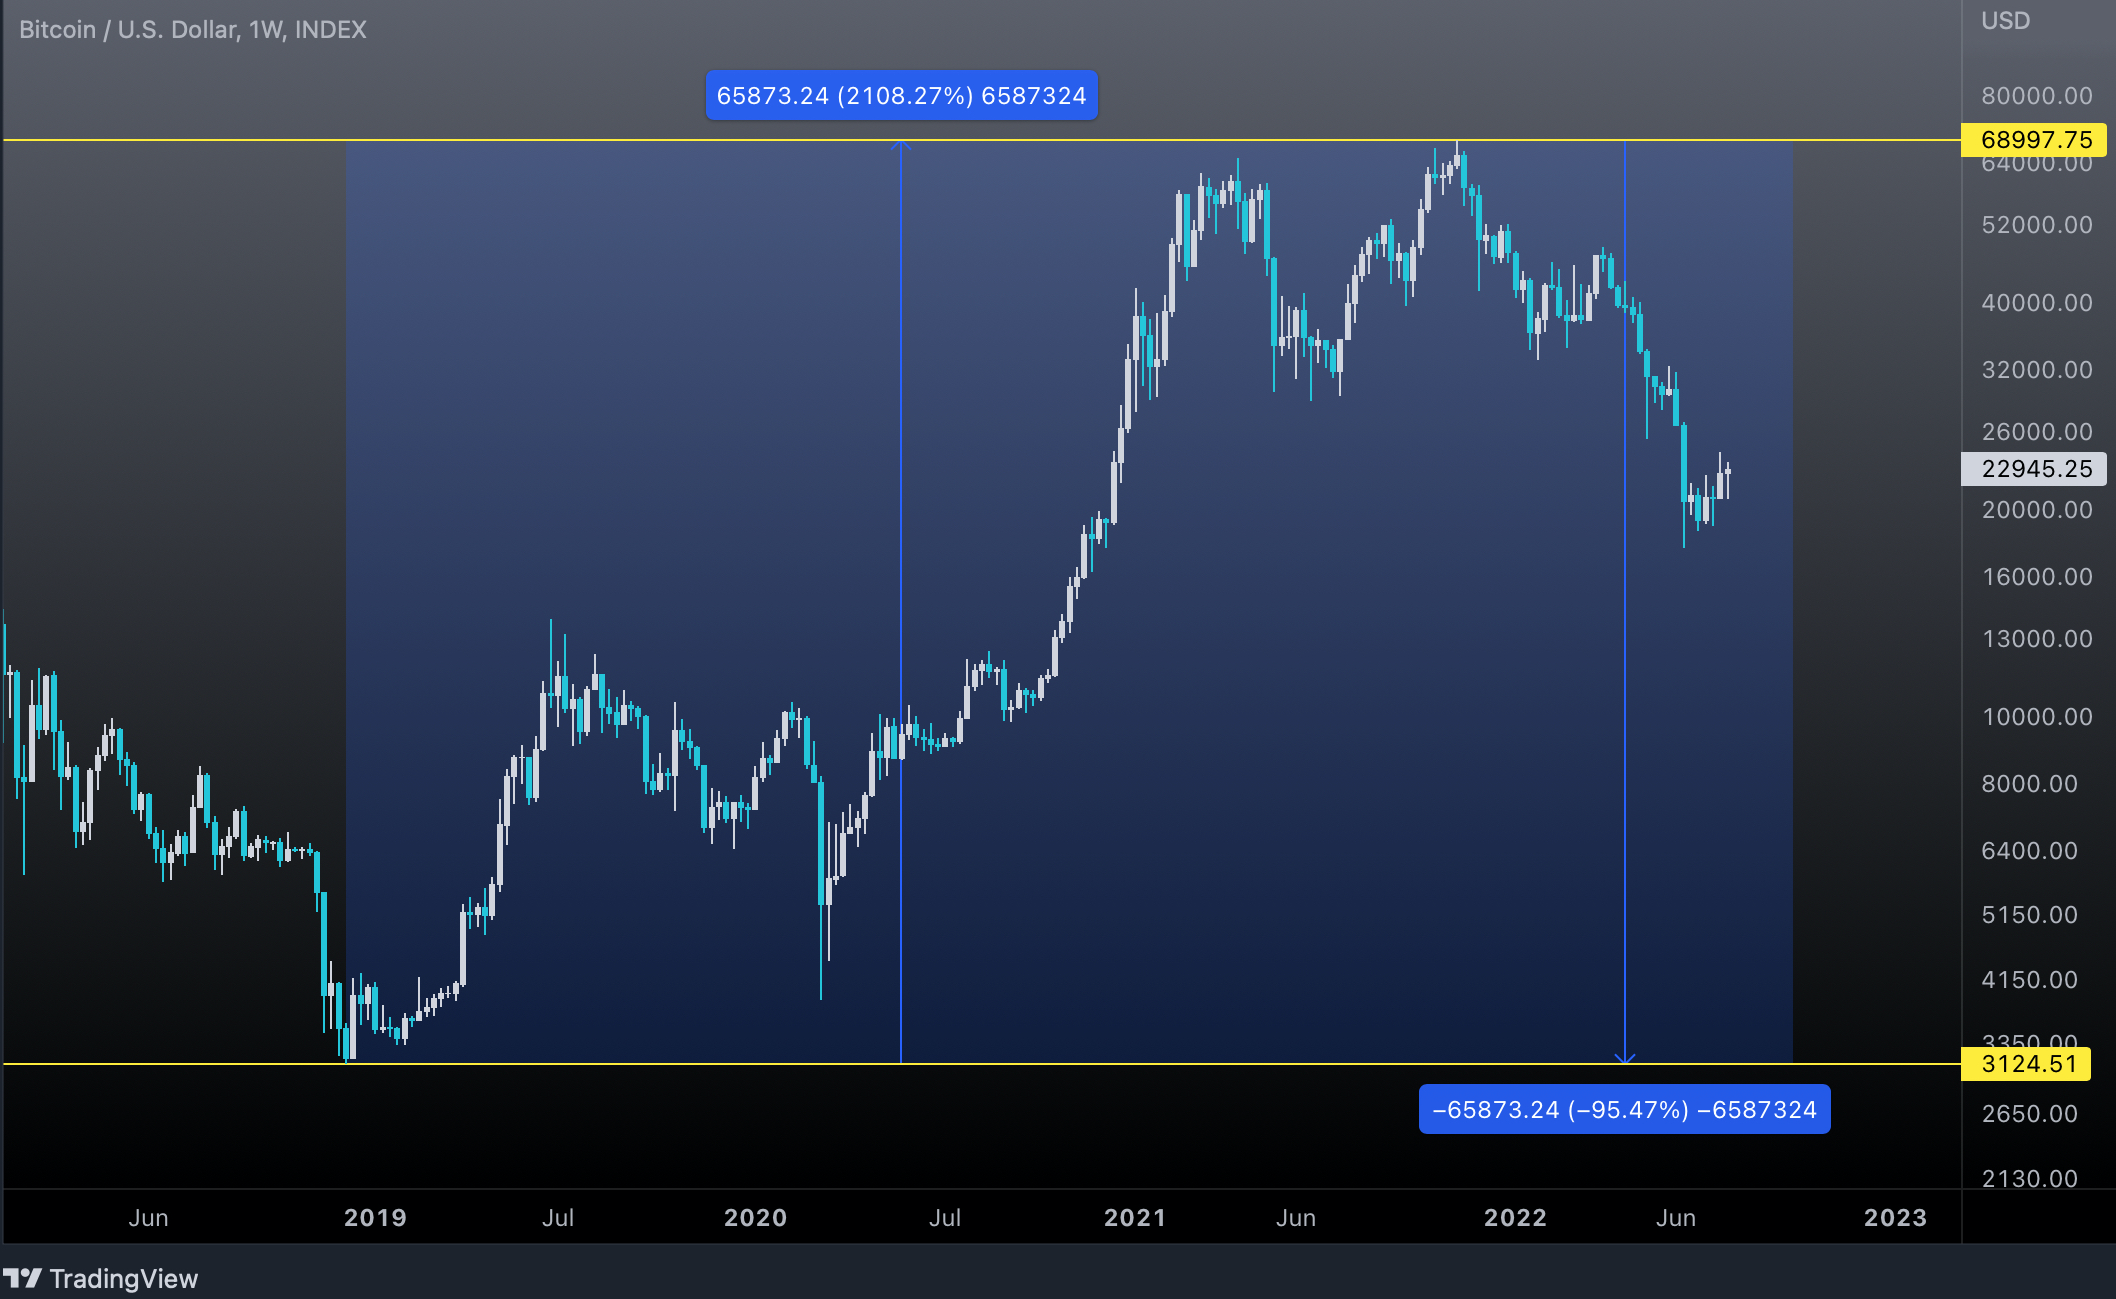
Using bitcoin as an example, on December 15th 2018, bitcoin’s price was $3,124 and marked the bottom of the bear market. On November 10th 2021, it reached its all-time high of $68,998, providing a total appreciation of 2,108%. If you had bought $1,000 worth at the bottom and sold at its all-time high, you would have profited $21,308. Hypothetically, if you had shorted $1,000 worth of bitcoin at the same peak and held the position the same bear market low of $3,124, you would’ve profited 95.47% or $954.7. As detailed, the reward is substantially skewed towards longing.
Another example, showcasing the increased probability of the market trending upwards, is that over the past 150 years the S&P 500 has closed 58% of its trading days higher than its opening price, compared to 42% where it closed lower. Bitcoin also has this exact same split of 58% and 42%, in favour of the higher closes.
To summarise, profits can be made during bear markets, but with the risk-reward heavily in favour of longing compared to shorting, it is essential to utilise confirmation of a bear trend to ensure your rules do not trade whilst the market is against you.